
Tank Bottom Flatness — Measured by 3D Laser Scanning
We scan the bottom or the whole tank and calculate how much the bottom plate deviates — the difference between the highest and lowest point, a deviation map, the locations of dents and a report ready for the client.
Tank bottom flatness shows how much the bottom plate of a tank deviates from a plane or from its design shape. We measure it with a 3D laser scanner: the bottom is divided into 25 mm cells, the elevation of each cell is the mean of dozens of points, and the accuracy per cell is better than 1 mm. The result is a single number — Δh — plus a deviation map, profiles and a report ready for the client.
In short
- Method: 3D laser scanning of the bottom only or of the whole tank from the inside.
- Resolution: 25 mm cells, accuracy per cell better than 1 mm.
- Main result: Δh — the difference between the highest and the lowest point of the bottom, in millimetres.
- Local dents: a virtual straightedge of 0.5, 1 and 2 m in four directions (DIN 18202, the logic of API 653 Annex B).
- Deliverables: report in PDF and Word, contours in DXF and all cells in CSV.
When is bottom flatness checked
- At acceptance of a new or repaired tank — is the bottom built according to the design.
- At periodic inspection of a tank in service — has the foundation settled, and where.
- Before repair — exactly where the dents are and how deep, so that plate replacement can be planned.
- When settlement of the foundation is suspected.
Re-scanning at the next inspection shows whether the deformations are growing. That is why the survey is also part of deformation monitoring of structures.
Δh — one number that answers the question
Δh = hmax − hmin
The main result is the maximum difference between the highest and the lowest point of the bottom, in millimetres. If the bottom is designed with a cone or a slope, we subtract the design shape and the number shows the deformation only. Without a design shape you get the absolute deviation and draw your own conclusions.
How we measure flatness, step by step
- Scanning. A laser scanner captures the bottom with millions of points. We can scan the bottom only or the whole tank from the inside.
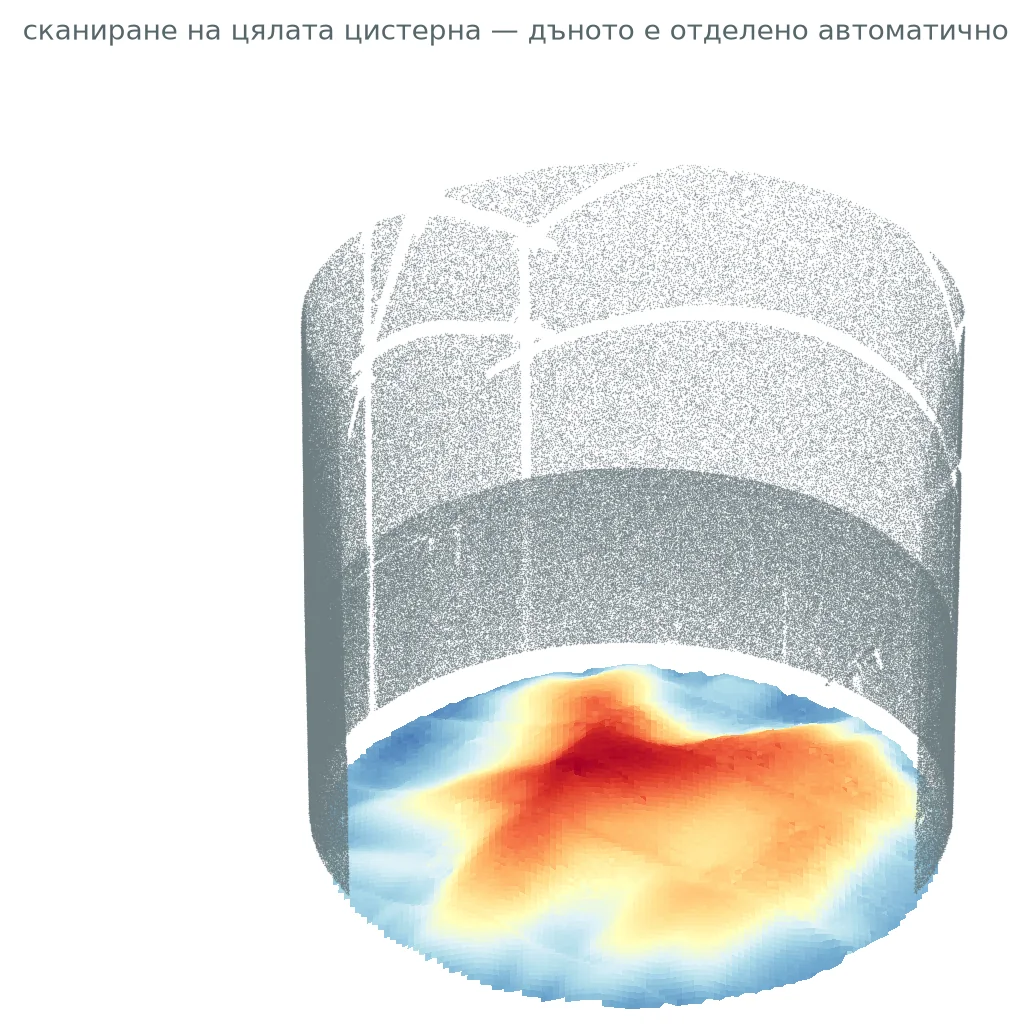
- Extracting the bottom. When the whole tank is scanned, the software finds the shell, the roof and the bottom automatically. Ladders, pipes, supports and objects left on the bottom are excluded together with a band around their base, so they are not mistaken for plate distortion.
- Calculation. The bottom is divided into square cells. Their size is chosen automatically: the smallest size at which at least 90 % of the area has real points, typically 25 mm. The cell elevation is the mean of dozens of points, so scanner noise is averaged out.
- Comparison with the design. If the bottom is designed with a cone or slope, we enter the design shape and the deviations are calculated against it.
- Report. You receive a report in PDF and Word, a DXF with the contours and a CSV table with all cells.
Virtual straightedge: dents and bulges
The overall difference between the highest and lowest point does not tell whether the bottom is evenly sloped or has local dents. That is why we place a straight edge everywhere on the bottom, in four directions, resting on its two ends. We check with straightedges of 0.5, 1 and 2 m.
How far the bottom lies below the straightedge is a dent; how far it rises above it is a bulge. This is the deflection (stichmaß) method of DIN 18202 and the logic API 653 Annex B uses to assess local settlement of tank bottoms.
What the client receives
| Result | What it shows | Format |
|---|---|---|
| Δh | The difference between the highest and lowest point, in mm | Report |
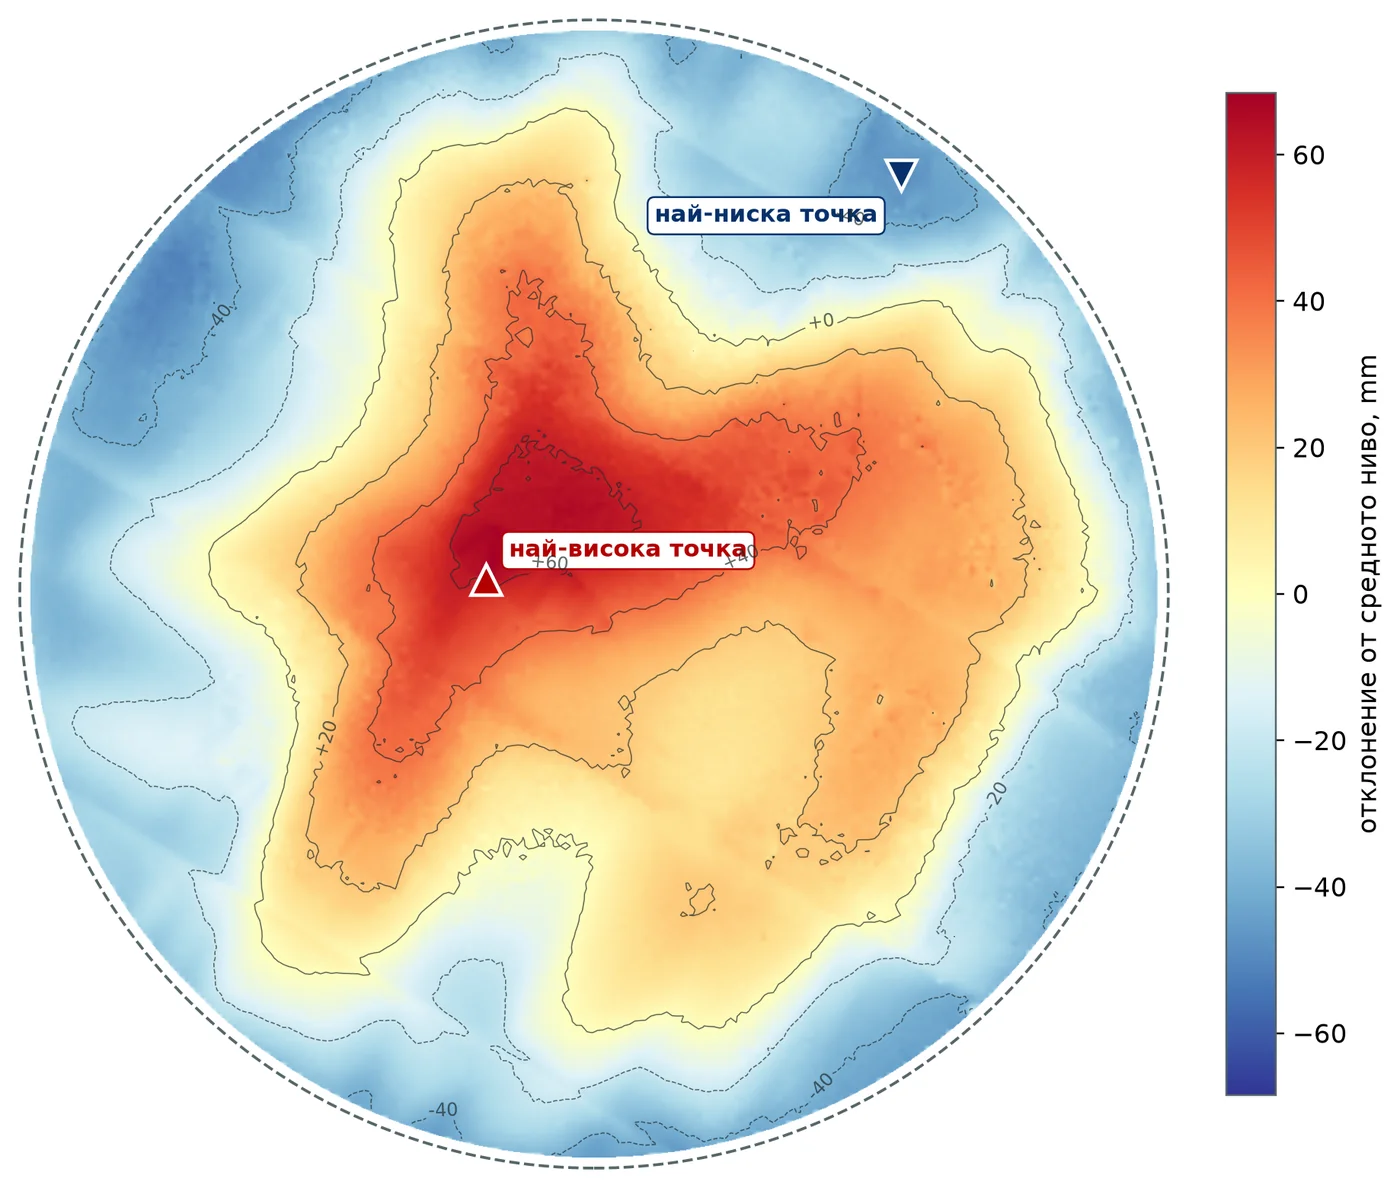
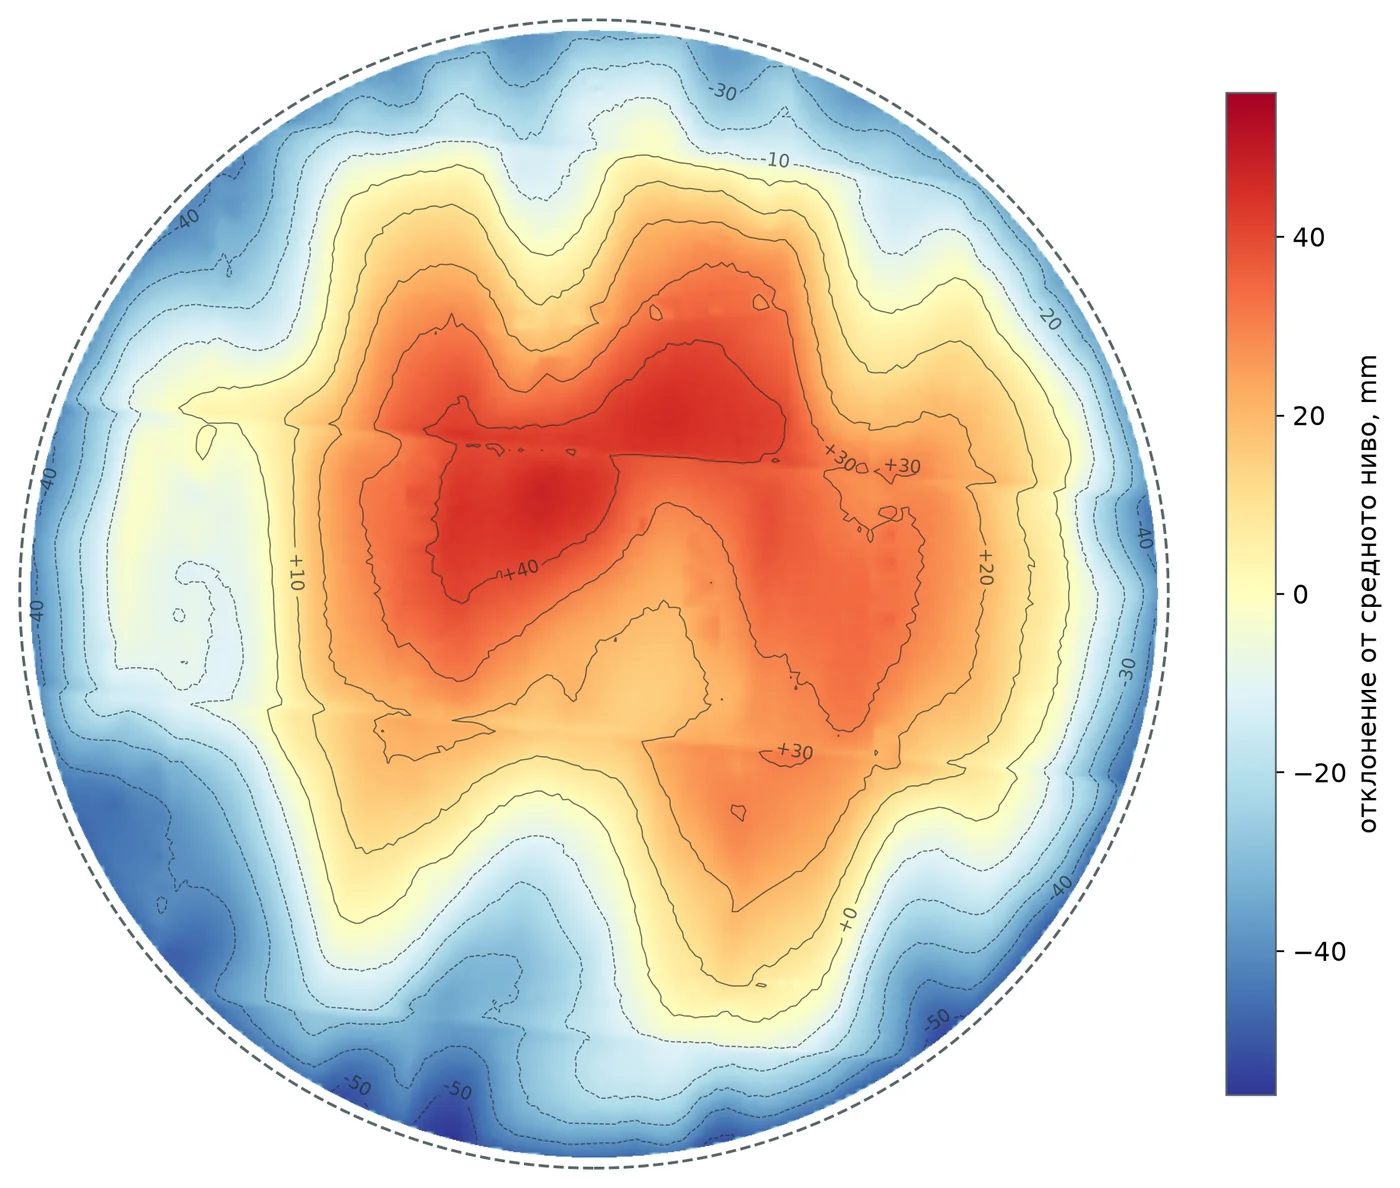
| Deviation map | Every spot of the bottom relative to the mean level, with contours and the highest and lowest point marked | PDF, Word |
| Dents under a straightedge | Where the bottom sags locally under a 0.5, 1 and 2 m straightedge, in four directions | PDF, Word |
| Profiles through the centre | Sections along both axes — a quick look at the shape of the bottom | PDF, Word |
| Tolerance (optional) | Which parts of the bottom are within tolerance and what percentage of the area | PDF, Word |
| Contours and values | Ready for CAD | DXF |
| Cell table | The elevation of every cell — for your own checks | CSV |
The report contains an explanatory note, tables and maps. The Word file can be edited freely if you want to add a conclusion or a signature.
No embellishing of the data
Objects and supports cast scan shadows. To keep the map complete we fill them by interpolation, but the highest and lowest points are taken only from cells that were actually measured. The report includes a coverage diagram showing what was measured and what was filled.
What the results look like
The examples are from real scans. Names, coordinates and orientation of the sites have been removed.
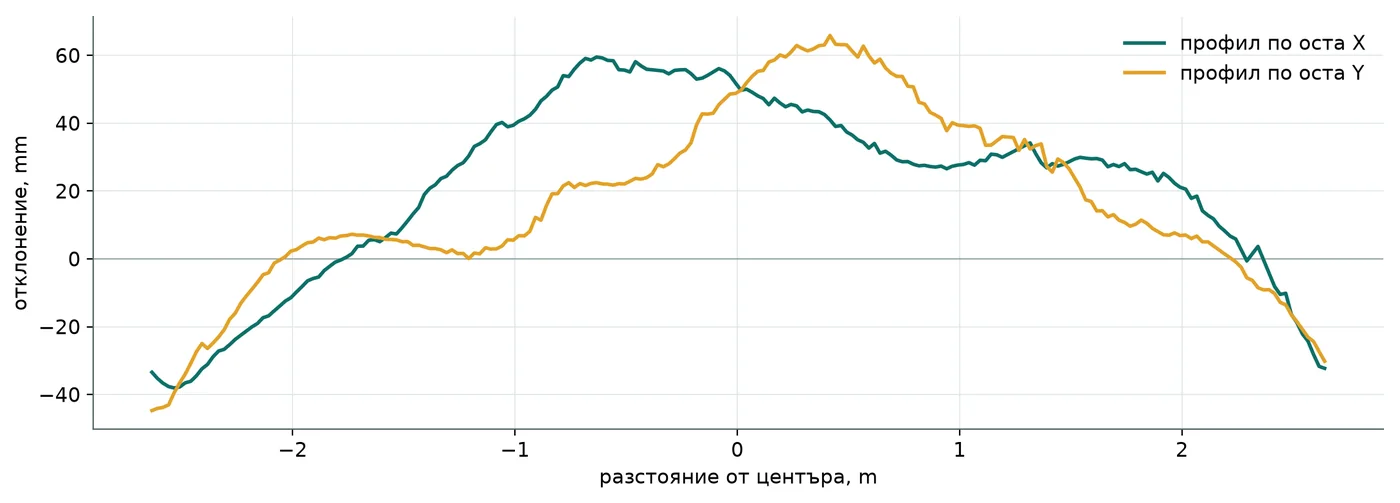
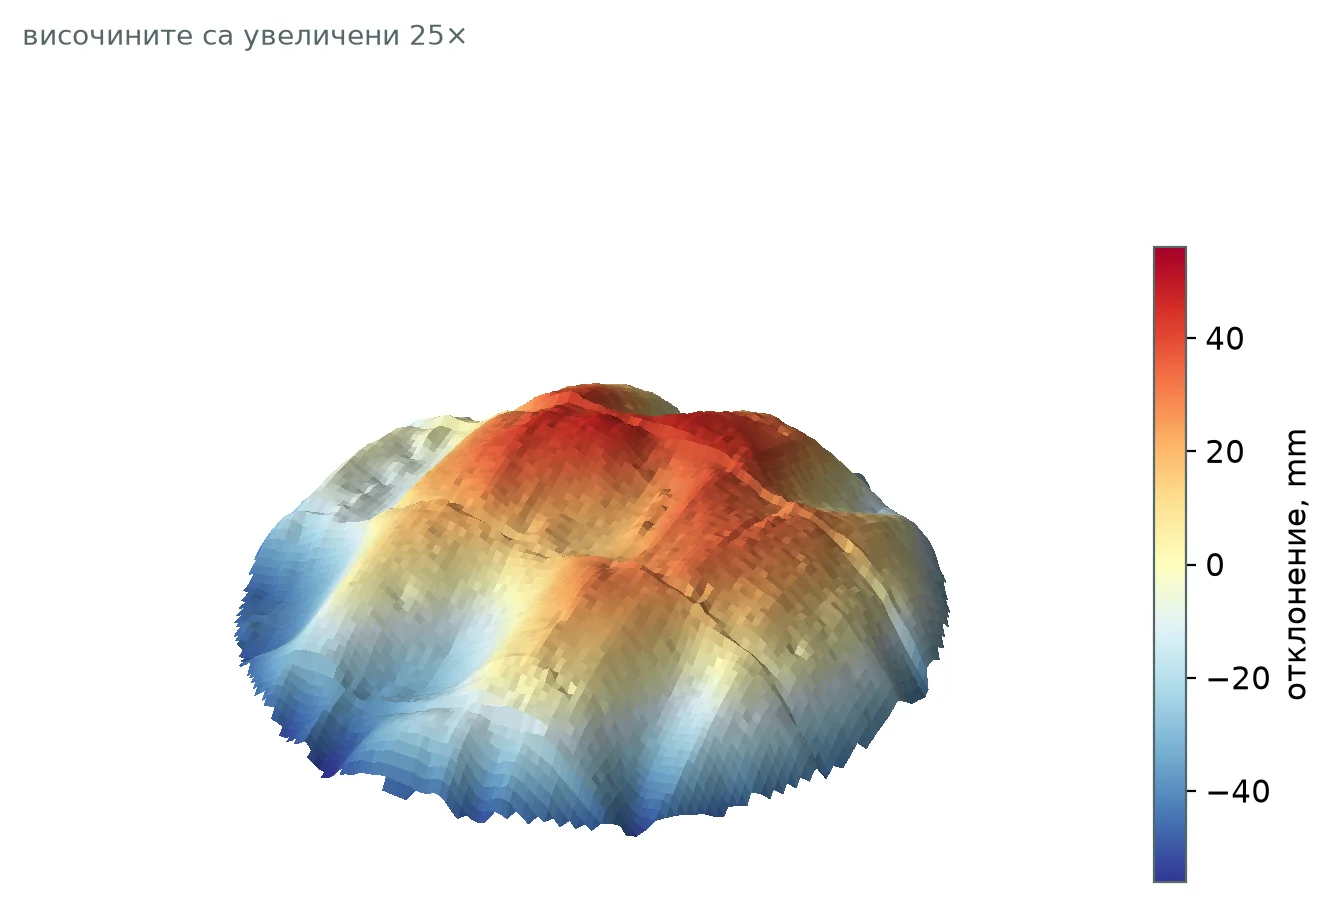
In this example the bottom is about 5.3 m in diameter. The centre is up to about 60 mm above the mean level and the rim up to about 45 mm below it. The map alone cannot tell whether this is a design cone or settlement. That is why, when a design exists, we subtract the design shape and Δh shows the deformation only.
Frequently asked questions
Does the tank have to be empty?
Yes. The laser does not measure under liquid, so the bottom must be emptied and accessible. We usually scan during a planned repair or cleaning, when the tank is made safe for entry.
How accurate is the measurement?
The elevation of each cell is the mean of dozens of points, so scanner noise is averaged out and the accuracy per cell is better than 1 mm. The cell size is chosen automatically, typically 25 mm.
What if the bottom is designed with a slope or a cone?
We enter the design shape and the deviations are calculated against it. Δh then shows the deformation only, not the design slope. Without a design you get the absolute deviation from the mean level.
Can only the bottom be scanned?
No. We can scan the bottom only or the whole tank from the inside — then the software separates the shell, the roof and the bottom automatically.
Have a tank to check?
Send us the diameter, whether the tank is in service and whether you have a design with the bottom shape. We will propose a scanning scheme and a timeline. Send an inquiry or see the 3D laser scanning service.
The project at a glance, with photos: Tank Bottom Flatness — 3D Laser Scanning. More completed work — in Projects.
Author: GM Engineering