
Stockpile Volumes with a LiDAR Drone — 15 Piles, 282,000 m³ in One Flight
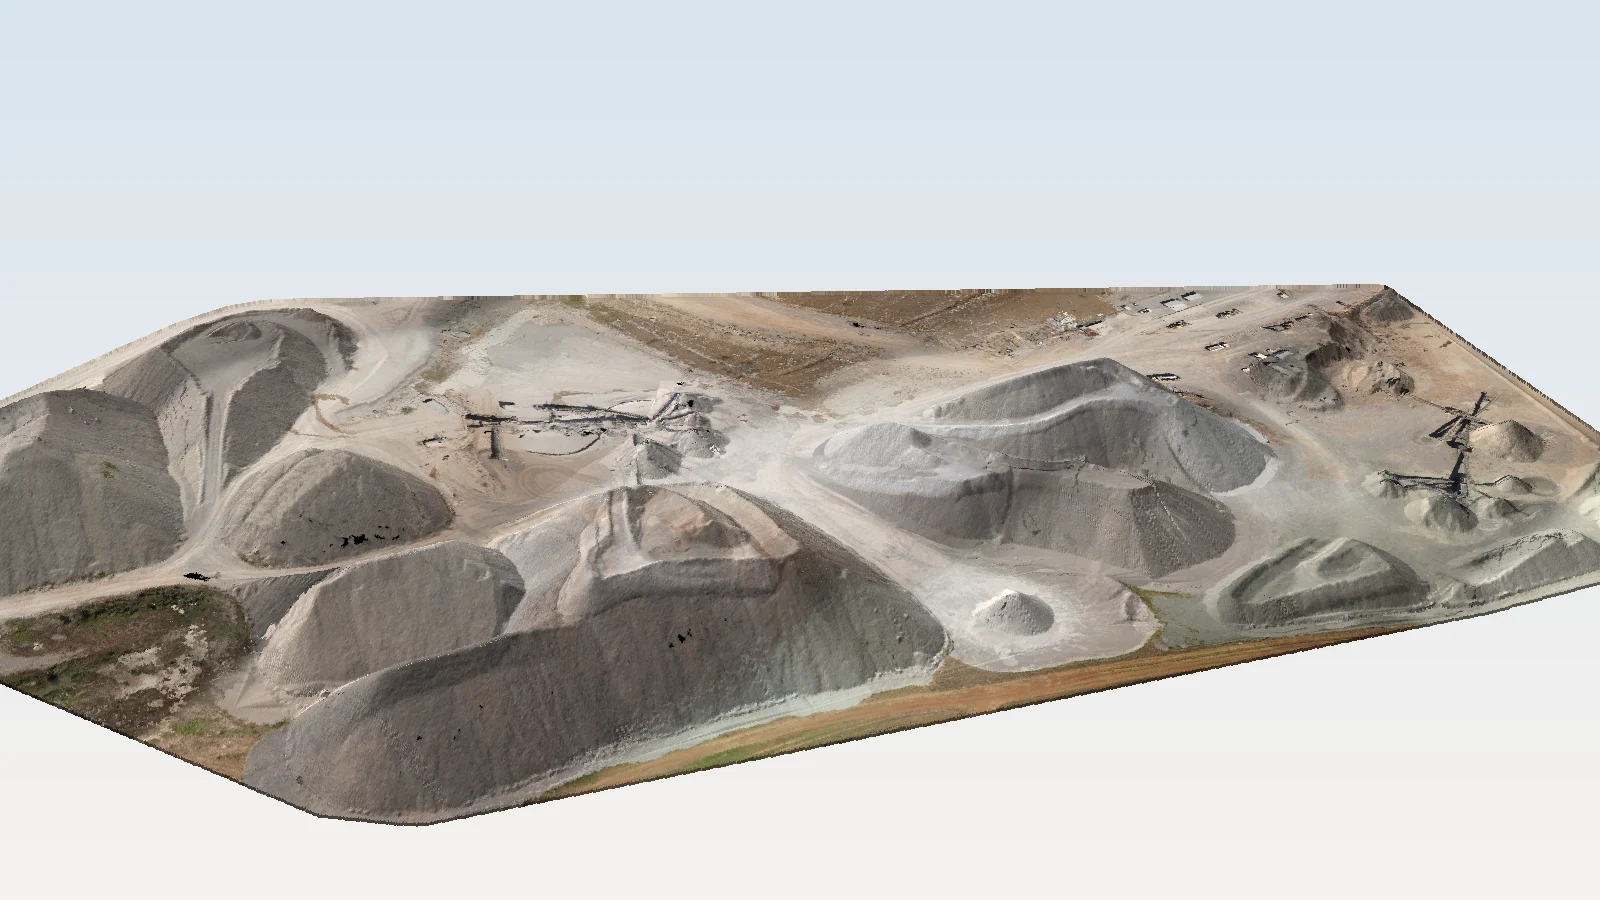
A crushing and screening yard with 15 piles of different fractions — surveyed in about 30 minutes with a LiDAR drone. We show how we separate each pile, how we calculate its volume against the base surface and what the report looks like — with maps, profiles and a 3D model.
Stockpile volume is measured as the difference between two surfaces: the surface of the pile today and the base surface — the ground beneath it. With a LiDAR drone we capture the whole yard at once, separate each pile as its own point cloud and calculate its volume, area and height. An inventory of an aggregate yard then takes one flight instead of days with a total station between working machines.
In short
- Survey: 4 August 2026, RIEGL miniVUX-3UAV LiDAR sensor on a drone plus a camera for the orthophoto (about 2 cm per pixel).
- Flight: 13 strips, about 30 minutes; tied to 14 ground control points, mean position correction about 1 cm.
- Piles: 15 piles of fractions 0/4, 4/8, 8/12.5, 4/12.5, 12.5/20, 0/40, 0/63 and 31.5/90.
- Total volume: about 282,000 m³, calculated on a 0.25 × 0.25 m grid against the base surface.
- Deliverables: table with volume, area and height of every pile, maps, profiles, 3D model and report.
The fractions on the yard
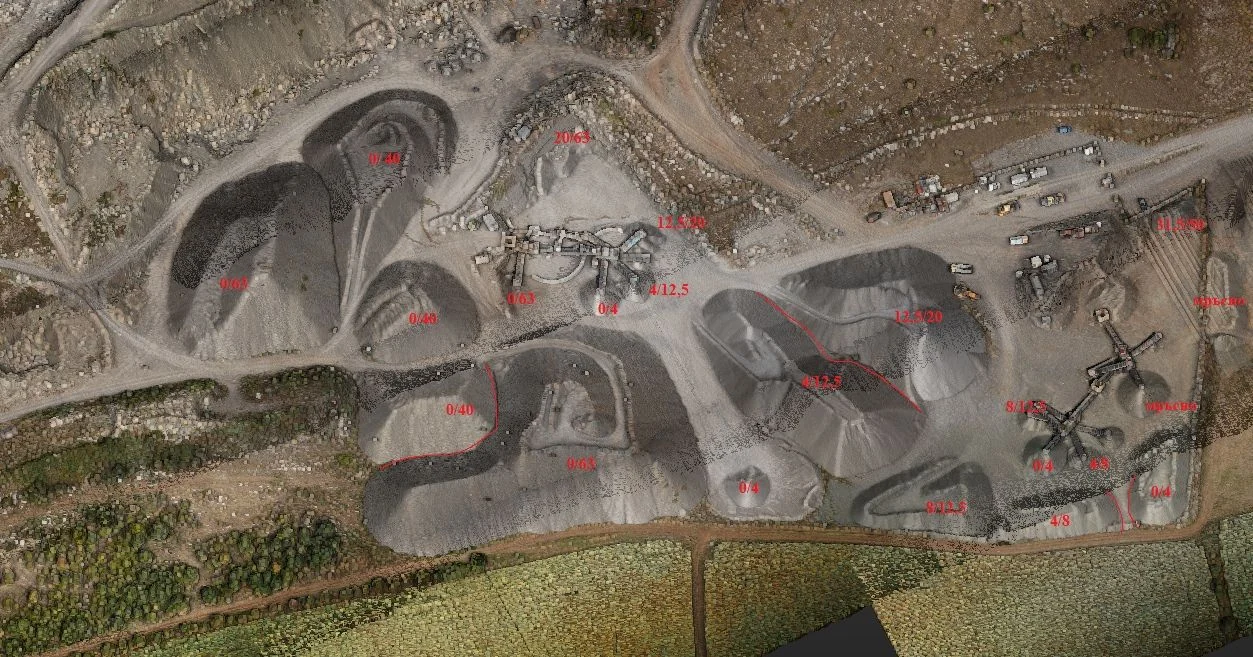
Each pile is a different material — from 0/4 sand to 31.5/90 coarse stone. In the picture the fractions are marked on the coloured point cloud; red lines are the boundaries where two materials share one pile.
How we separate the piles and calculate the volume
- Flight and point cloud. The laser captures the yard at over a hundred points per m², including the steep pile slopes that photogrammetry often “smooths”.
- Base surface. We build the ground surface under the piles — from an earlier survey, from the design, or from the ground points around each pile.
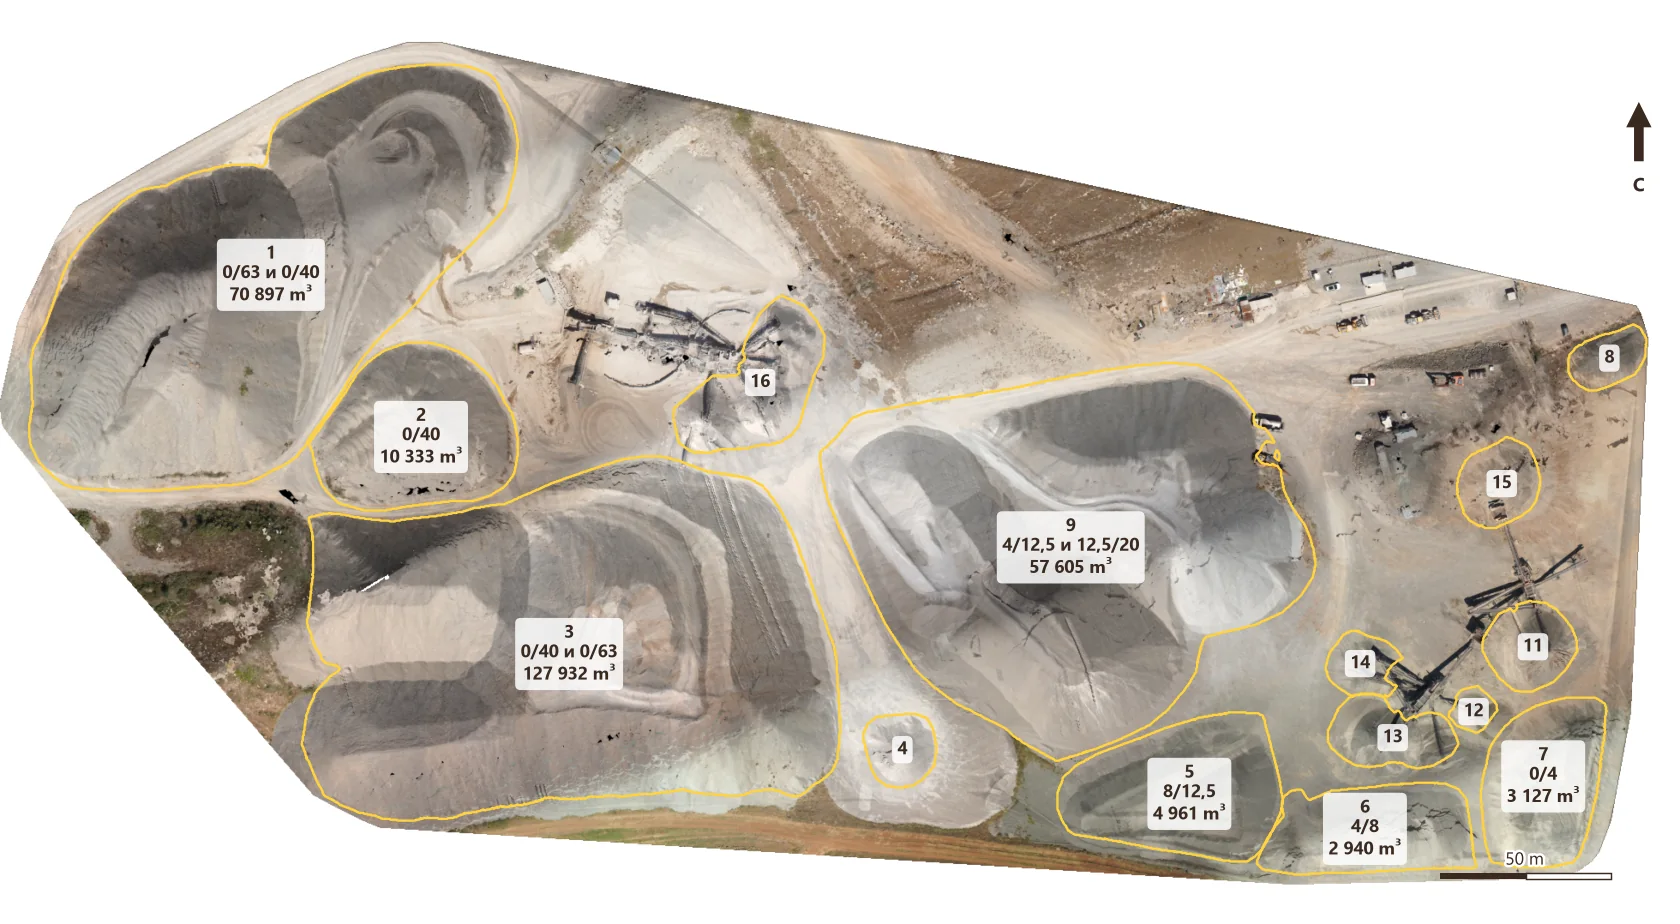
- Pile separation. Each pile becomes its own point cloud and is linked to its fraction using the orthophoto. When two materials share a pile, the boundary is set with a line and the volume is split.
- Automatic calculation. From here on processing is automatic — minutes, not days: surface of every pile, difference to the base surface, volume, area, height, maps and profiles.
- Report. A table by pile and fraction, maps and profiles — ready for accounting or an inventory committee.
The results
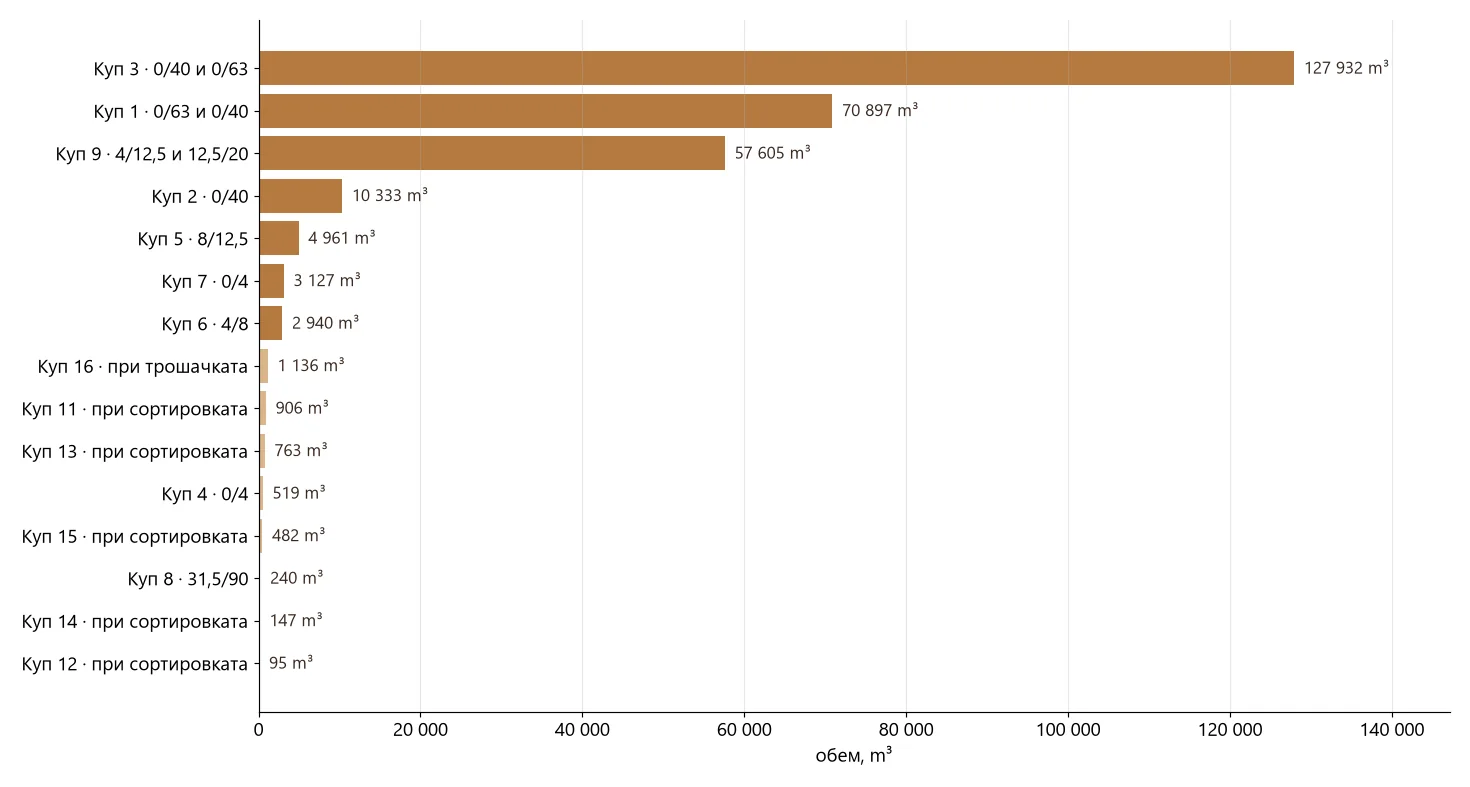
| Pile | Fraction | Area | Height | Volume |
|---|---|---|---|---|
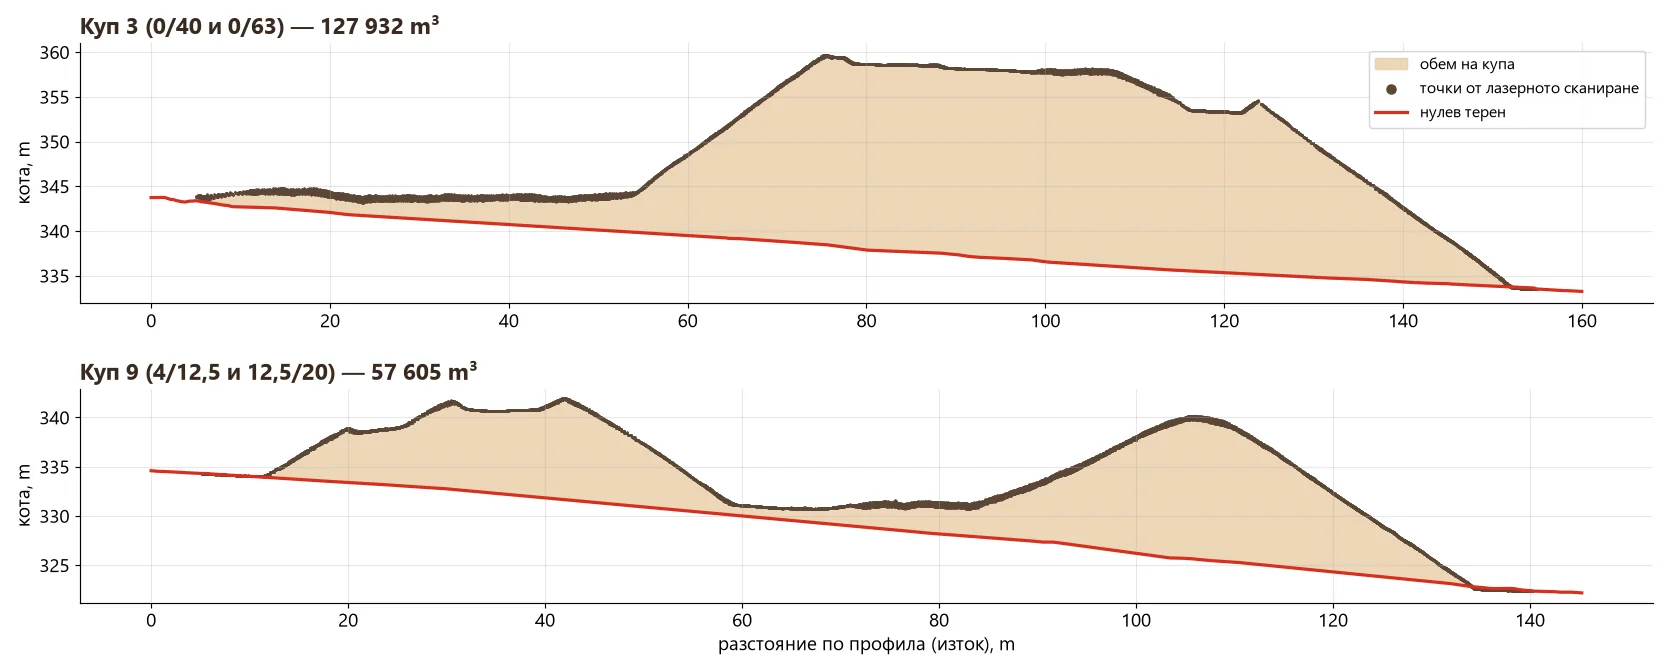
| 3 | 0/40 and 0/63 | 13,412 m² | 23.2 m | 127,932 m³ |
| 1 | 0/63 and 0/40 | 10,825 m² | 20.6 m | 70,897 m³ |
| 9 | 4/12.5 and 12.5/20 | 11,419 m² | 15.1 m | 57,605 m³ |
| 2 | 0/40 | 2,248 m² | 12.5 m | 10,333 m³ |
| 5 | 8/12.5 | 2,098 m² | 6.3 m | 4,961 m³ |
| 7 | 0/4 | 1,457 m² | 5.5 m | 3,127 m³ |
| 6 | 4/8 | 1,397 m² | 6.3 m | 2,940 m³ |
| 4 | 0/4 | 370 m² | 5.6 m | 519 m³ |
| 8 | 31.5/90 | 301 m² | 2.7 m | 240 m³ |
| 11–16 | small piles at the plants | 3,175 m² | up to 7.3 m | 3,529 m³ |
| Total | ≈ 282,082 m³ |
Height is above the base surface (excluding isolated points from dust and machinery). Volumes are bulk volumes — given a bulk density for each fraction we convert them to tonnes.
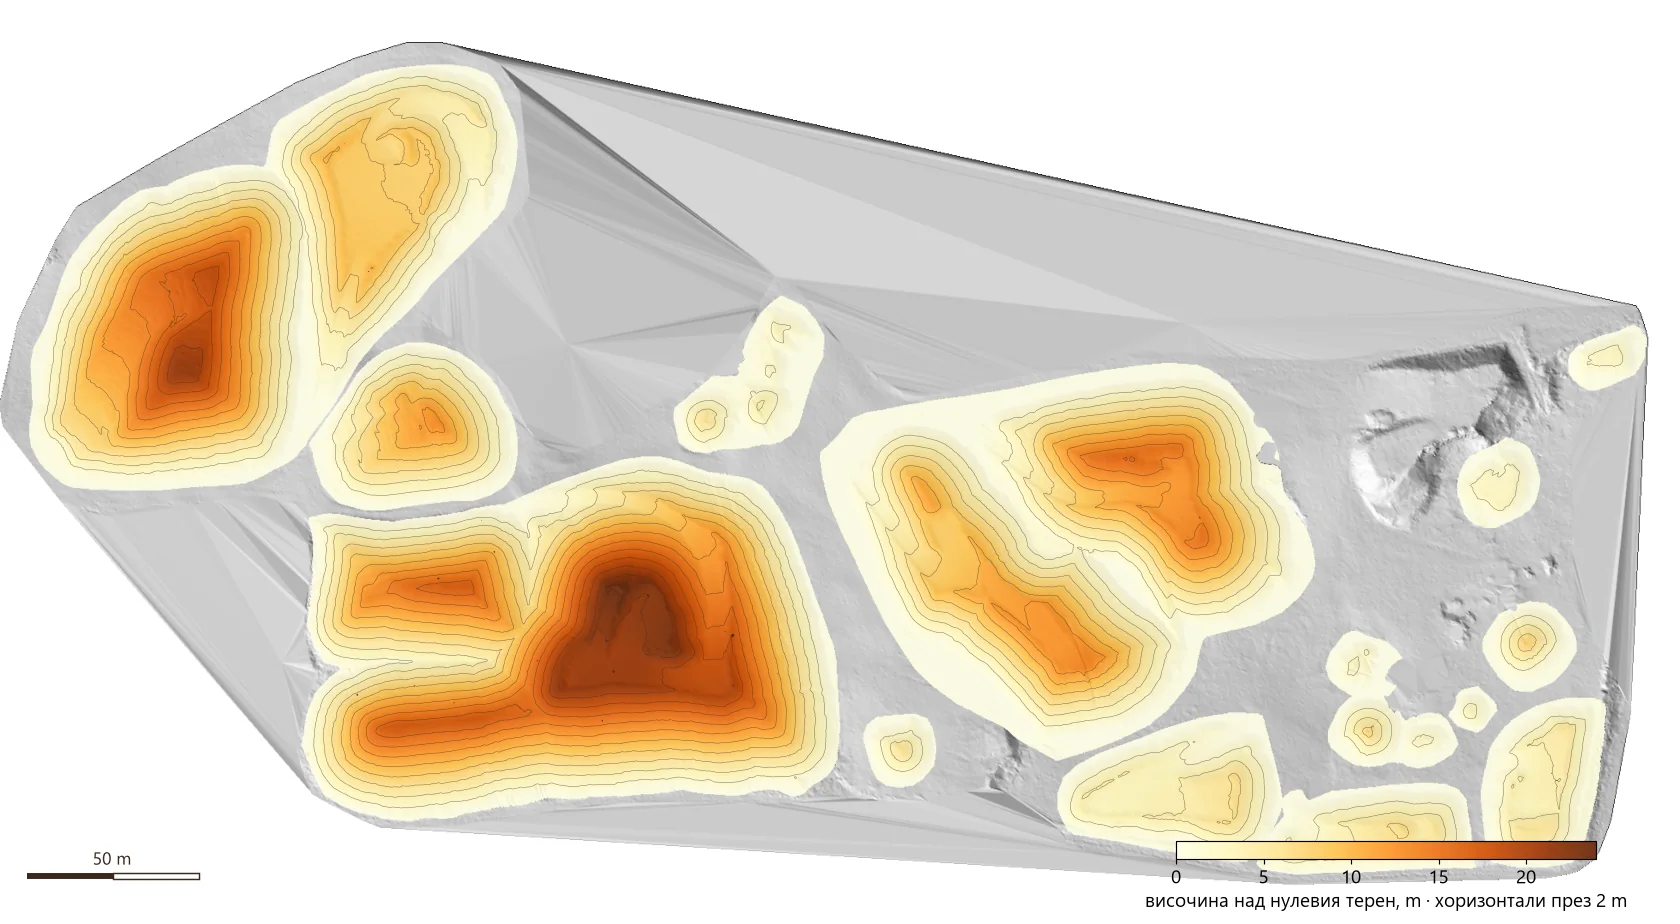
Height above the base surface
The map shows the thickness of material at every point — how many metres there are from the base surface to the surface of the pile. It shows where most of the material is and how each pile is shaped.
Profiles — what exactly is calculated
The profile shows the calculation literally: the laser points on top, the base surface below (red), and the shaded area between them, summed over the whole pile, is the volume.
Why LiDAR and not a total station or photogrammetry
- Safety — nobody climbs the slopes or walks between the loaders.
- Completeness — millions of points on every pile instead of a few hundred hand-picked ones.
- Sharp edges and slopes are captured accurately — photogrammetry smooths them, especially on uniform grey material.
- Speed — 15 piles in one flight, the report minutes after processing.
- Repeatability — the next survey is compared with this one and shows how much material was produced or sold.
What it is used for
- Monthly or annual inventory of an aggregate yard.
- Production control — how much was extracted and how much sold between two surveys.
- Quarries and landfills — volumes of excavation, fill and spoil heaps.
- Construction sites — earthworks, temporary stockpiles, embankments.
Frequently asked questions
How accurate are the volumes?
The volume is calculated from millions of points on a 0.25 m grid, and the flight is tied to ground control points. The largest uncertainty usually comes from the base surface, so it is important that it is surveyed or defined correctly.
What is the base surface and where does it come from?
It is the ground surface under the piles. We take it from a survey before stockpiling, from the yard design, or build it from the ground points around each pile.
Can we get tonnes instead of cubic metres?
Yes. Given a bulk density for each fraction, volumes are converted to tonnes in the same table.
Have a yard or quarry to survey?
Send us the location, the approximate area and how often you need the volumes. We will propose a flight and a timeline. Send an inquiry or see the Drone LiDAR surveying service. See also how LiDAR captures the terrain under a forest.
The project at a glance, with photos: Volumes of 15 Aggregate Stockpiles — LiDAR Drone. More completed work — in Projects.
Author: GM Engineering