
Power Line Sag — Measured with a LiDAR Drone, and What the Bulgarian Ordinance No. 3 Requires
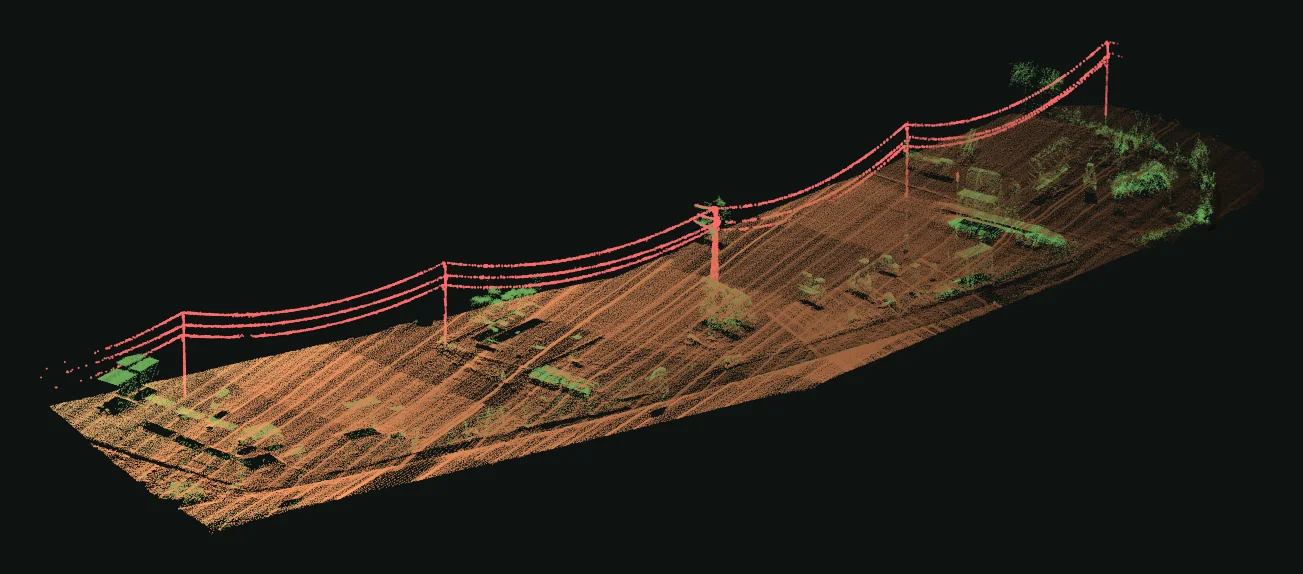
With a LiDAR drone we surveyed a section of a medium-voltage overhead line — 5 poles and 15 conductors. We show how the sag of each conductor and its clearance to the ground and to objects under the line are calculated from the point cloud, and what Ordinance No. 3 requires.
Sag is the vertical distance between the straight line through the two attachment points and the lowest point of the conductor in the span. More important for safety is clearance — how high above the ground, the road or the building the conductor passes at its lowest point. With a LiDAR drone we measure both for every conductor separately, without switching the line off and without climbing the poles.
In short
- Survey: 4 August 2026, RIEGL miniVUX-3UAV LiDAR sensor on a drone; a flight of about 3 minutes tied to 8 ground control points.
- Line: medium-voltage overhead line, 5 poles, spans of 56 to 64 m, plus a 40.5 m branch.
- Conductors: 15 conductors — each described by a catenary, mean deviation of the points 1–2 cm.
- Sag: from 1.0 to 2.4 m.
- Ground clearance: minimum 6.69 m; to an object under the line — 2.4 m.
What Ordinance No. 3 requires
In Bulgaria the minimum clearances are set by Ordinance No. 3 of 2004 on electrical installations and power lines. They are checked at maximum sag — at an air temperature of +40 °C or with ice at −5 °C without wind, without accounting for conductor heating by the current (Art. 620(3)).
| Minimum vertical clearance of the conductors | up to 20 kV | 110 kV | 220 kV | 400 kV |
|---|---|---|---|---|
| to the ground — unpopulated area (Art. 620, Table 45) | 6 m | 6 m | 7 m | 8 m |
| to the ground — hard-to-reach area | 5 m | 5 m | 6 m | 7 m |
| to the ground — inaccessible area | 3 m | 3 m | 4 m | 5 m |
| to the ground — populated area (Art. 634, Table 47) | 7 m | 7 m | 8 m | 9 m |
| to the carriageway (Art. 672, Table 55) | 7.6 m | 7.6 m | 8.6 m | 9.0 m |
| to the rail head, non-electrified railway (Art. 663, Table 54) | 7.5 m | 7.5 m | 8.5 m | 9.5 m |
The ordinance also sets horizontal clearances to buildings from the outer conductors at their maximum deflection — 2 m at 20 kV, 4 m at 110 kV, 6 m at 220 kV and 9 m at 400 kV (Art. 637). Through forests the corridor width is the distance between the outer conductors plus 6 m for trees up to 4 m, and for taller trees plus twice their mean height (Art. 622). Easement zones around lines are in Ordinance No. 16 of 2004 on easements of energy facilities.
Sources (in Bulgarian): the text of Ordinance No. 3 and Ordinance No. 16. The values are for normal operation; for emergency conditions and for 750 kV the ordinance has separate requirements.
Sag and clearance — what exactly is measured
How we measure it
- LiDAR flight. The drone flies over the route; the laser captures the poles, every conductor, the ground and everything under the line — vegetation, buildings, roads.
- Conductor extraction. Conductor points are separated from the cloud, and each conductor in each span is separated automatically from its neighbours.
- Catenary. A catenary curve is fitted to the points of each conductor — so the sag and the lowest point are determined even where points are sparser.
- Clearances. From the curve to the terrain model and to objects under the line we calculate the smallest vertical distance and its position in the span.
- Recalculation to maximum sag. The survey is taken at a specific temperature and load. With the conductor data from the operator, the sag is recalculated to +40 °C and to ice load — and only then are the clearances compared with the requirements.
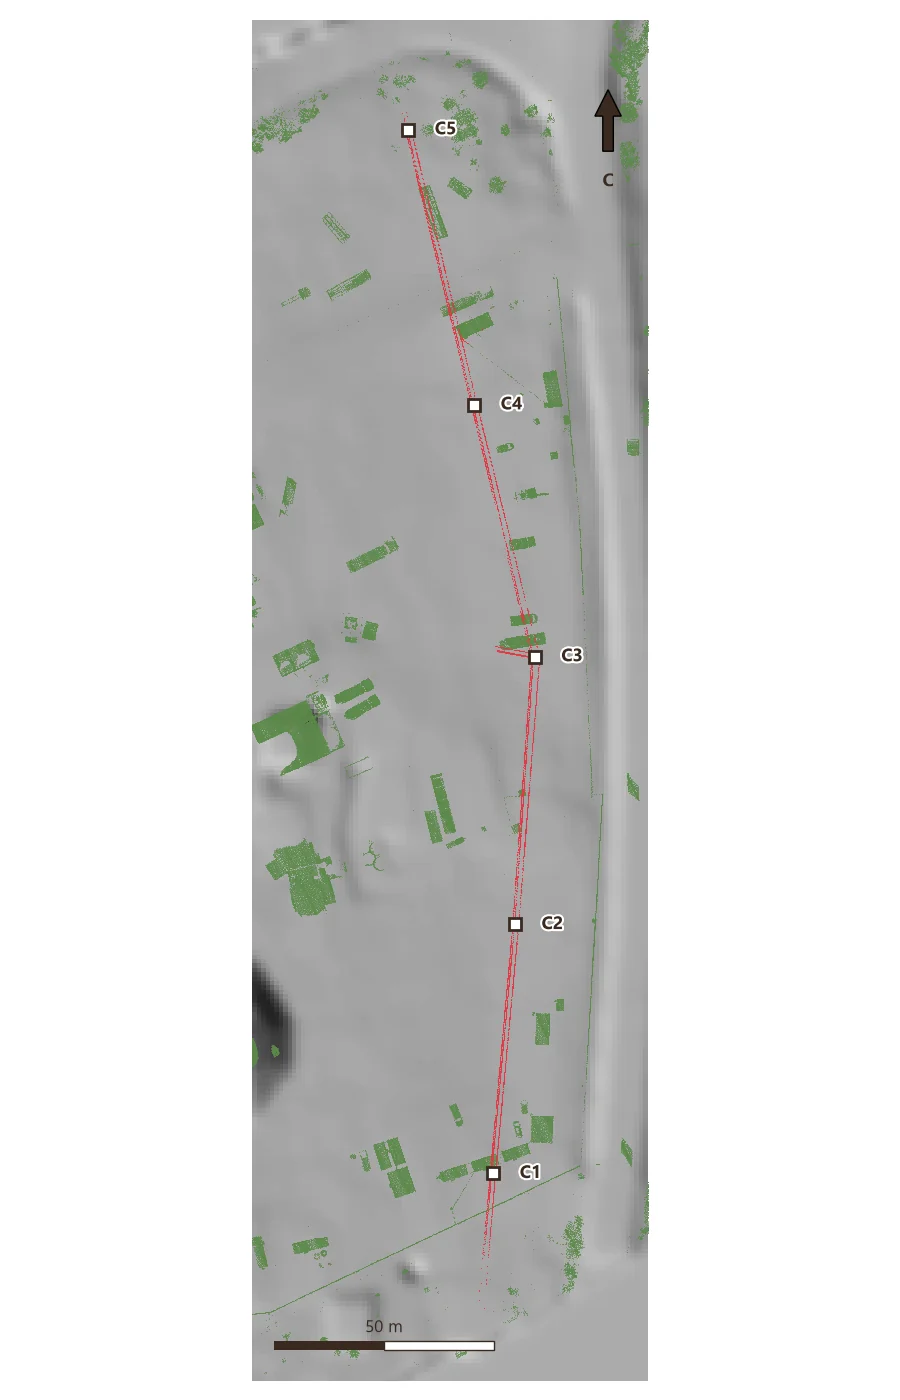
Survey results
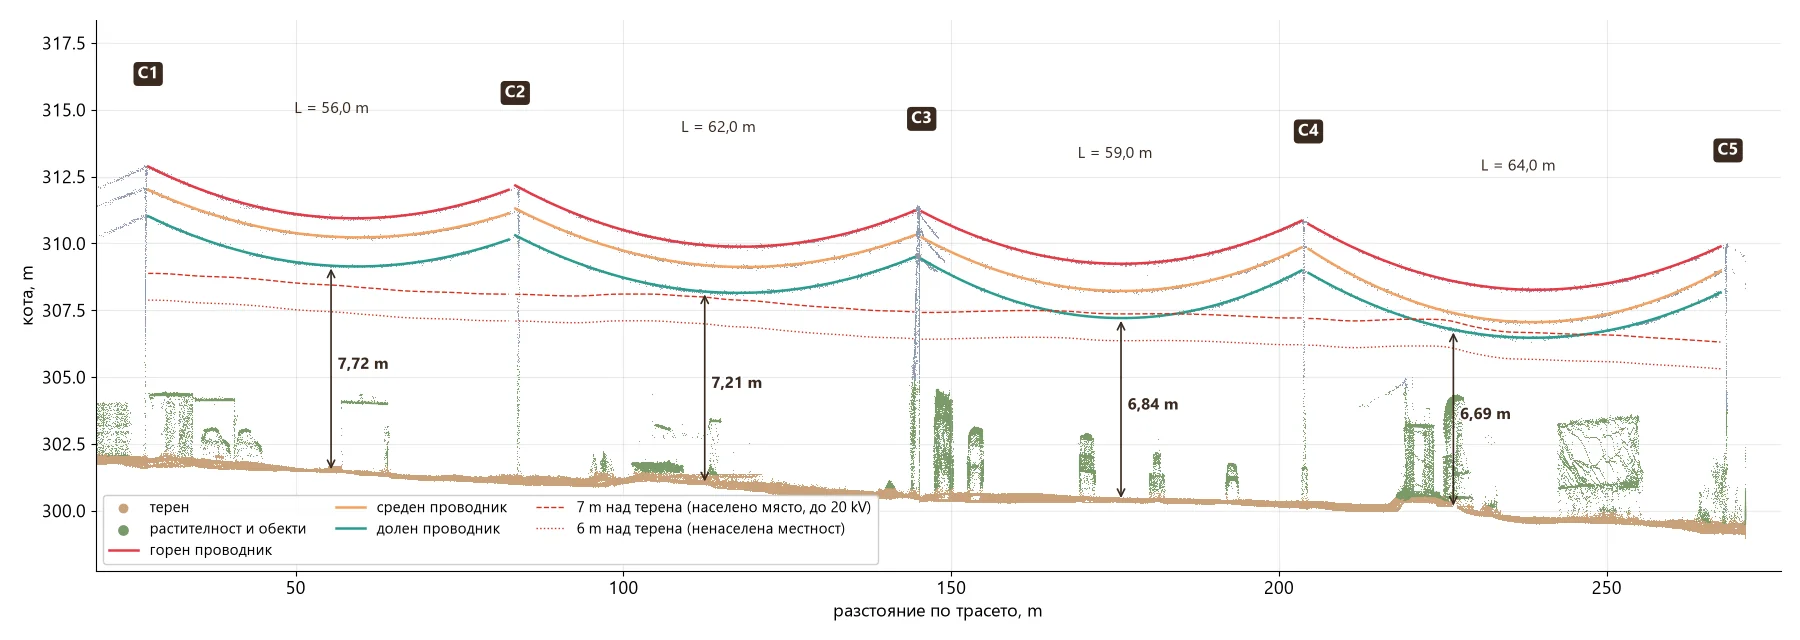
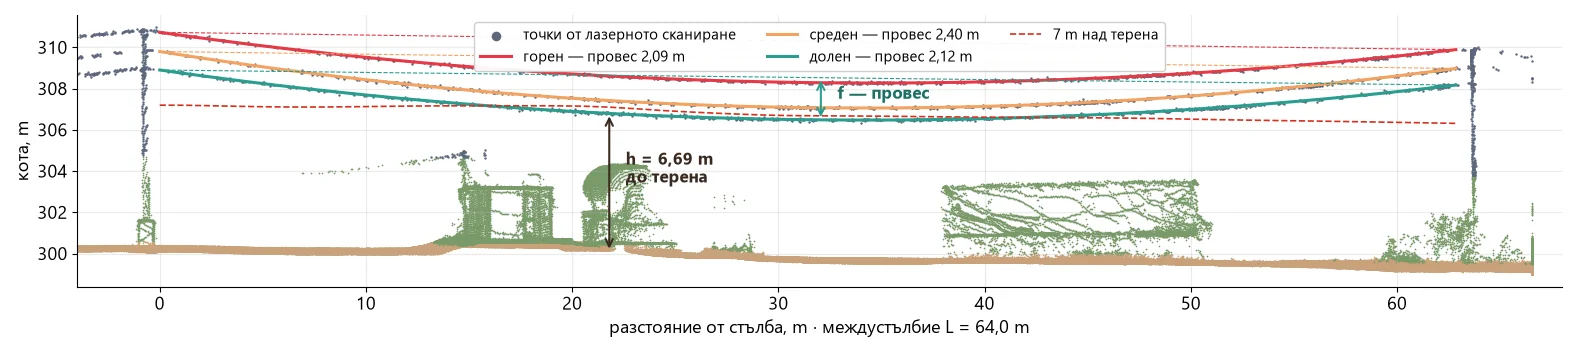
The profile along the route shows the three conductors in each span, the ground beneath them and the lines 6 and 7 m above the ground. The arrows mark the lowest point of the bottom conductor in each span.
| Span | Length | Sag (top / middle / bottom) | Minimum ground clearance | To object under the line |
|---|---|---|---|---|
| C1–C2 | 56.0 m | 1.52 / 1.35 / 1.46 m | 7.72 m | 5.99 m |
| C2–C3 | 62.0 m | 1.85 / 1.71 / 1.79 m | 7.21 m | 4.69 m |
| C3–C4 | 59.0 m | 1.85 / 1.88 / 2.07 m | 6.84 m | 4.46 m |
| C4–C5 | 64.0 m | 2.09 / 2.40 / 2.12 m | 6.69 m | 2.40 m |
| Branch from C3 | 40.5 m | 1.18 / 1.35 / 1.02 m | 7.83 m | 4.47 m |
Clearances are for the bottom conductor, which is closest to the ground.
What the results show
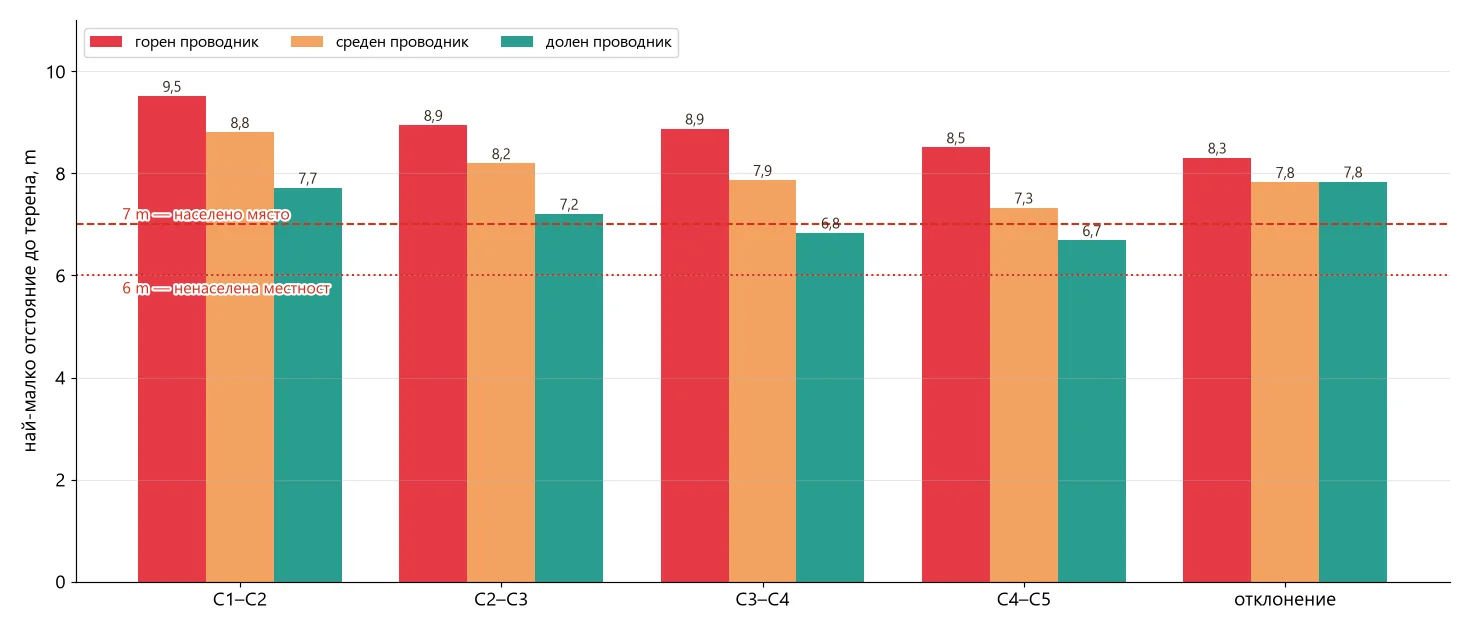
- Against 6 m (unpopulated area, up to 110 kV) all conductors have a margin — the smallest is 0.69 m.
- Against 7 m (populated area) the bottom conductor in spans C3–C4 and C4–C5 is below 7 m already at survey conditions.
- At +40 °C the sag will be larger and the clearances smaller. That is why, with a small margin, a recalculation is made with the conductor data.
- The object under the line in C4–C5 is only 2.4 m below the bottom conductor — such spots are checked on site together with the network operator.
Which requirement applies — populated, unpopulated or hard-to-reach area, road or railway — is determined for each span separately. The line voltage and conductor type are confirmed by the operator.
What the client receives
| Result | Format |
|---|---|
| Classified point cloud — ground, poles, conductors, vegetation, buildings | LAS / LAZ |
| 3D model of the conductors (catenaries) and poles | DWG / DXF |
| Table by span: length, sag, clearances, position of the lowest point | XLSX / PDF |
| Profiles along the route with the regulatory lines | PDF / DWG |
| Objects and vegetation dangerously close to the conductors | SHP / KML, PDF |
| Report with methodology, accuracy and conclusions |
Frequently asked questions
Does the line have to be switched off?
No. The drone flies at a safe distance above and beside the line and does not touch it. The survey requires no outage and does not interrupt the power supply.
What is the accuracy?
The cloud is tied to ground control points, and the catenary of each conductor is fitted to hundreds of points. In this example the mean deviation of the points from the curves is 1–2 cm.
Why is the measured sag not the final answer?
Sag depends on temperature and load. The ordinance requires clearances at maximum sag (+40 °C or ice), so the measured geometry is recalculated to those conditions using the conductor data.
Can the vegetation under the line be checked?
Yes. The same cloud shows every tree and shrub under and around the conductors — their height and the distance to the nearest conductor. This is how corridor clearing is planned.
Have a line to check?
Send us the route (KML, DWG or a sketch), the voltage and what you need the data for — clearance check, reconstruction design or corridor clearing. We will propose a flight and a timeline. Send an inquiry or see the Drone LiDAR surveying service.
The project at a glance, with photos: Sag and Clearances of a Medium-Voltage Overhead Line — LiDAR Drone. More completed work — in Projects.
Author: GM Engineering