Mobile MappingMMS solutions for railways
09.2026
GM Engineering
Central and Eastern Europe
What is Mobile Mapping?
About MMS
The process of collecting geo-spatial data while in motion, using positioning and data-collection sensors. These sensors work together to track location and capture detailed information about the surrounding environment.
Mobile Mapping is based on trajectories.
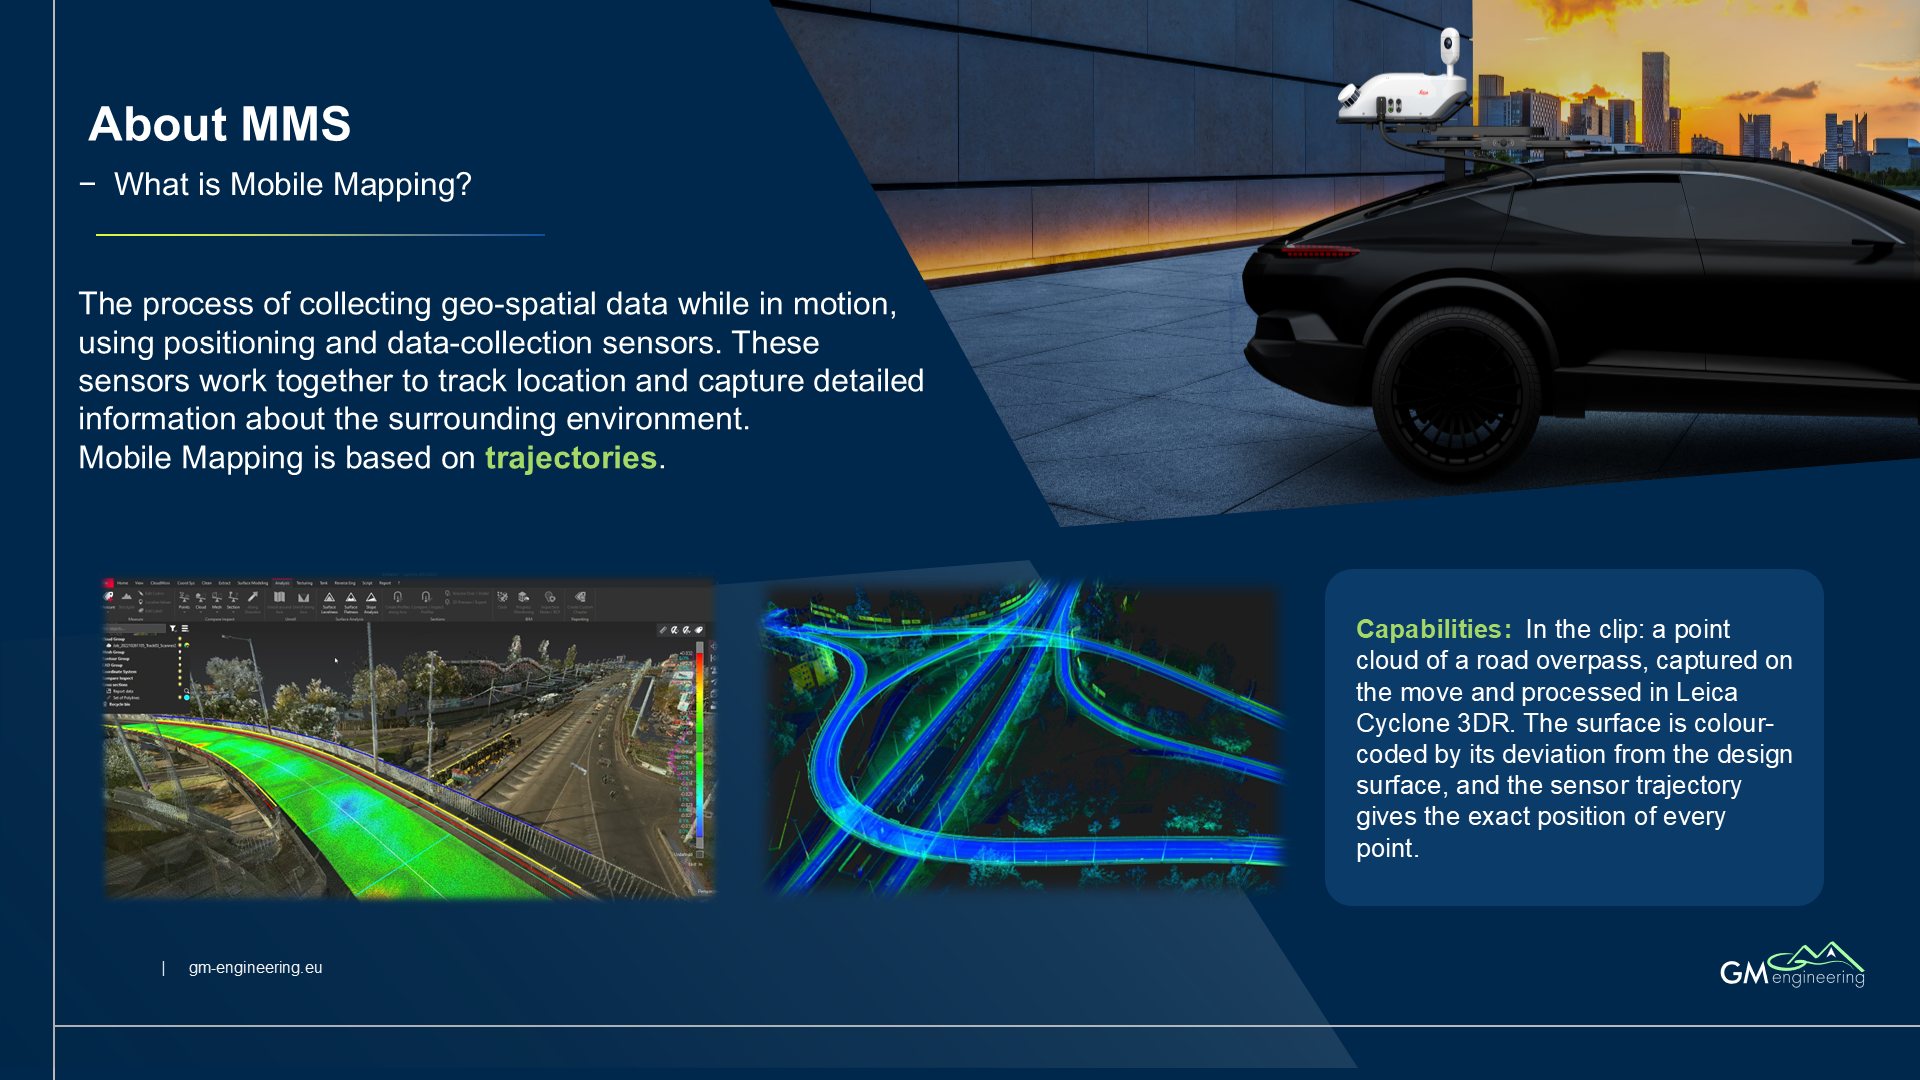
Capabilities: In the clip: a point cloud of a road overpass, captured on the move and processed in Leica Cyclone 3DR. The surface is colour-coded by its deviation from the design surface, and the sensor trajectory gives the exact position of every point.
Why Mobile Mapping?
Traditional surveying
Mobile Mapping
vs.
Safety, efficiency, on time, on budget
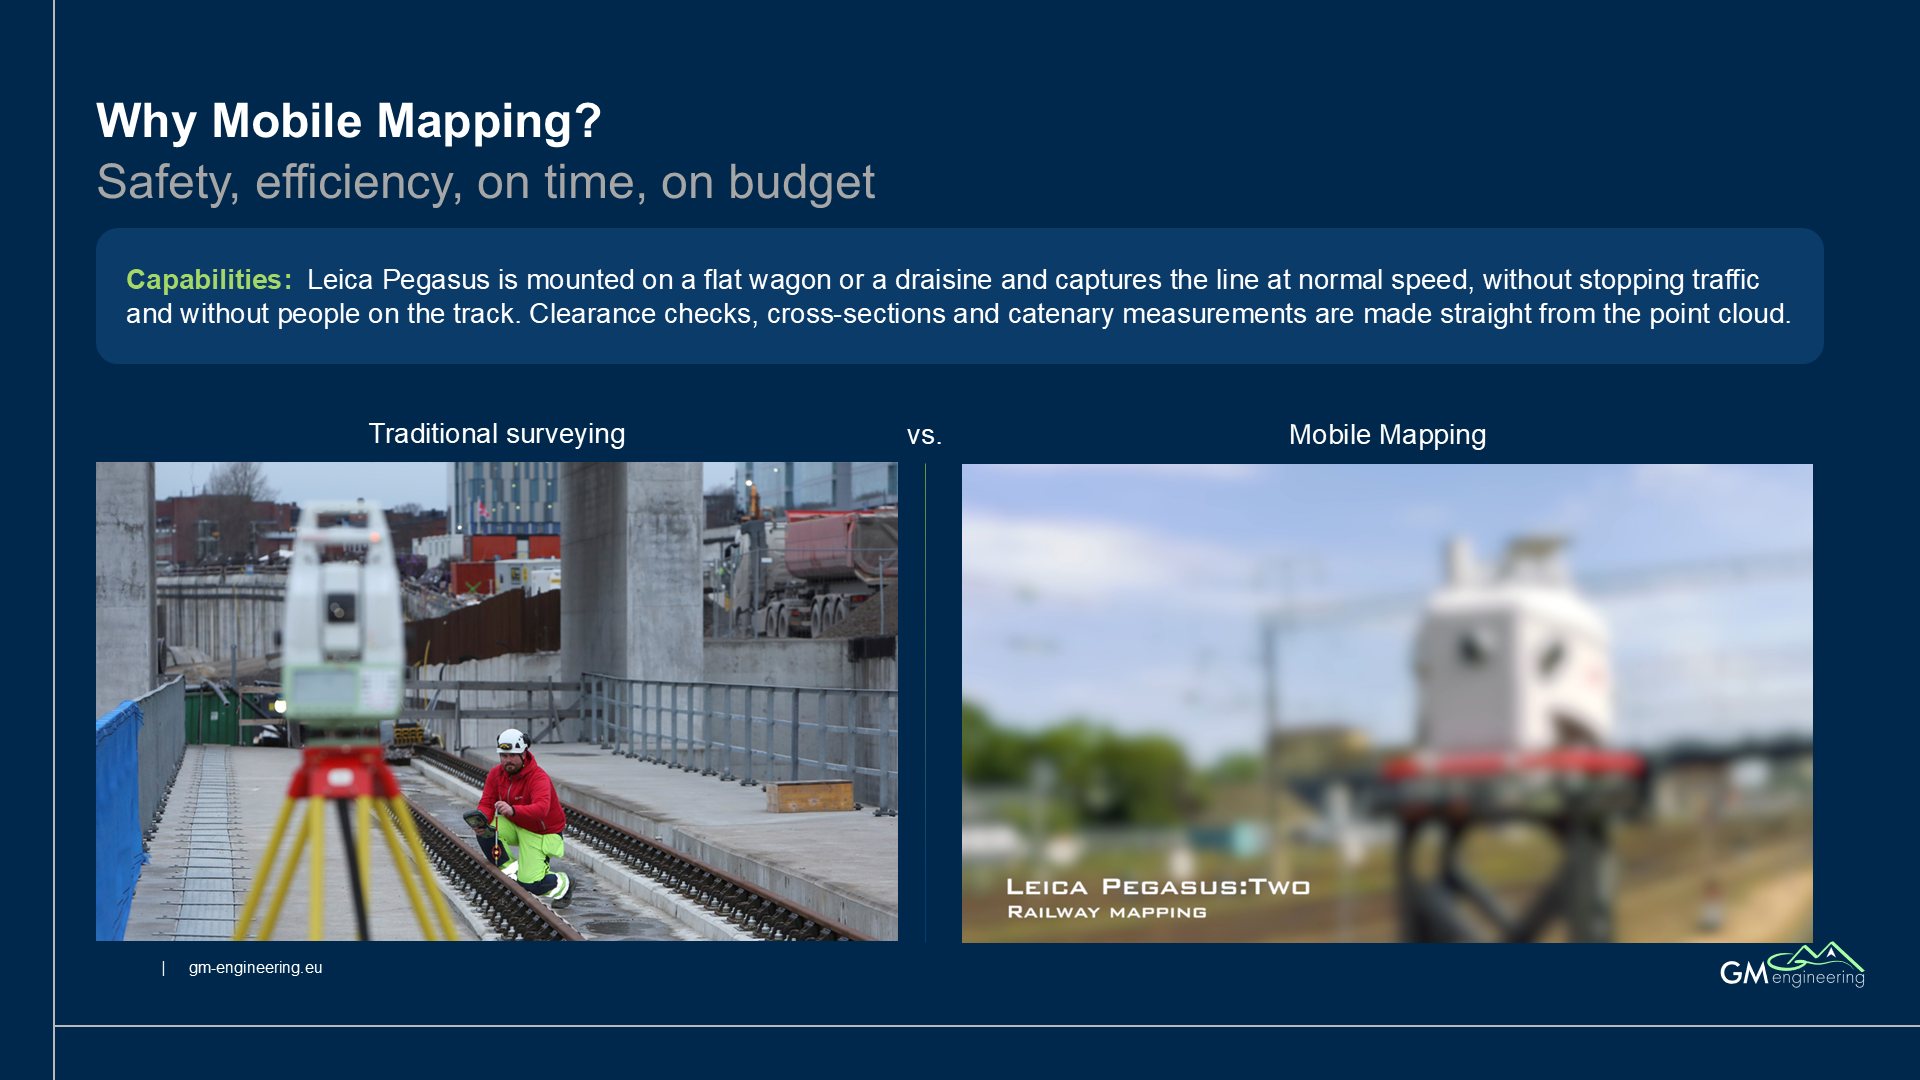
Capabilities: Leica Pegasus is mounted on a flat wagon or a draisine and captures the line at normal speed, without stopping traffic and without people on the track. Clearance checks, cross-sections and catenary measurements are made straight from the point cloud.
Why Mobile Mapping and Pegasus TRK?
Flexibility
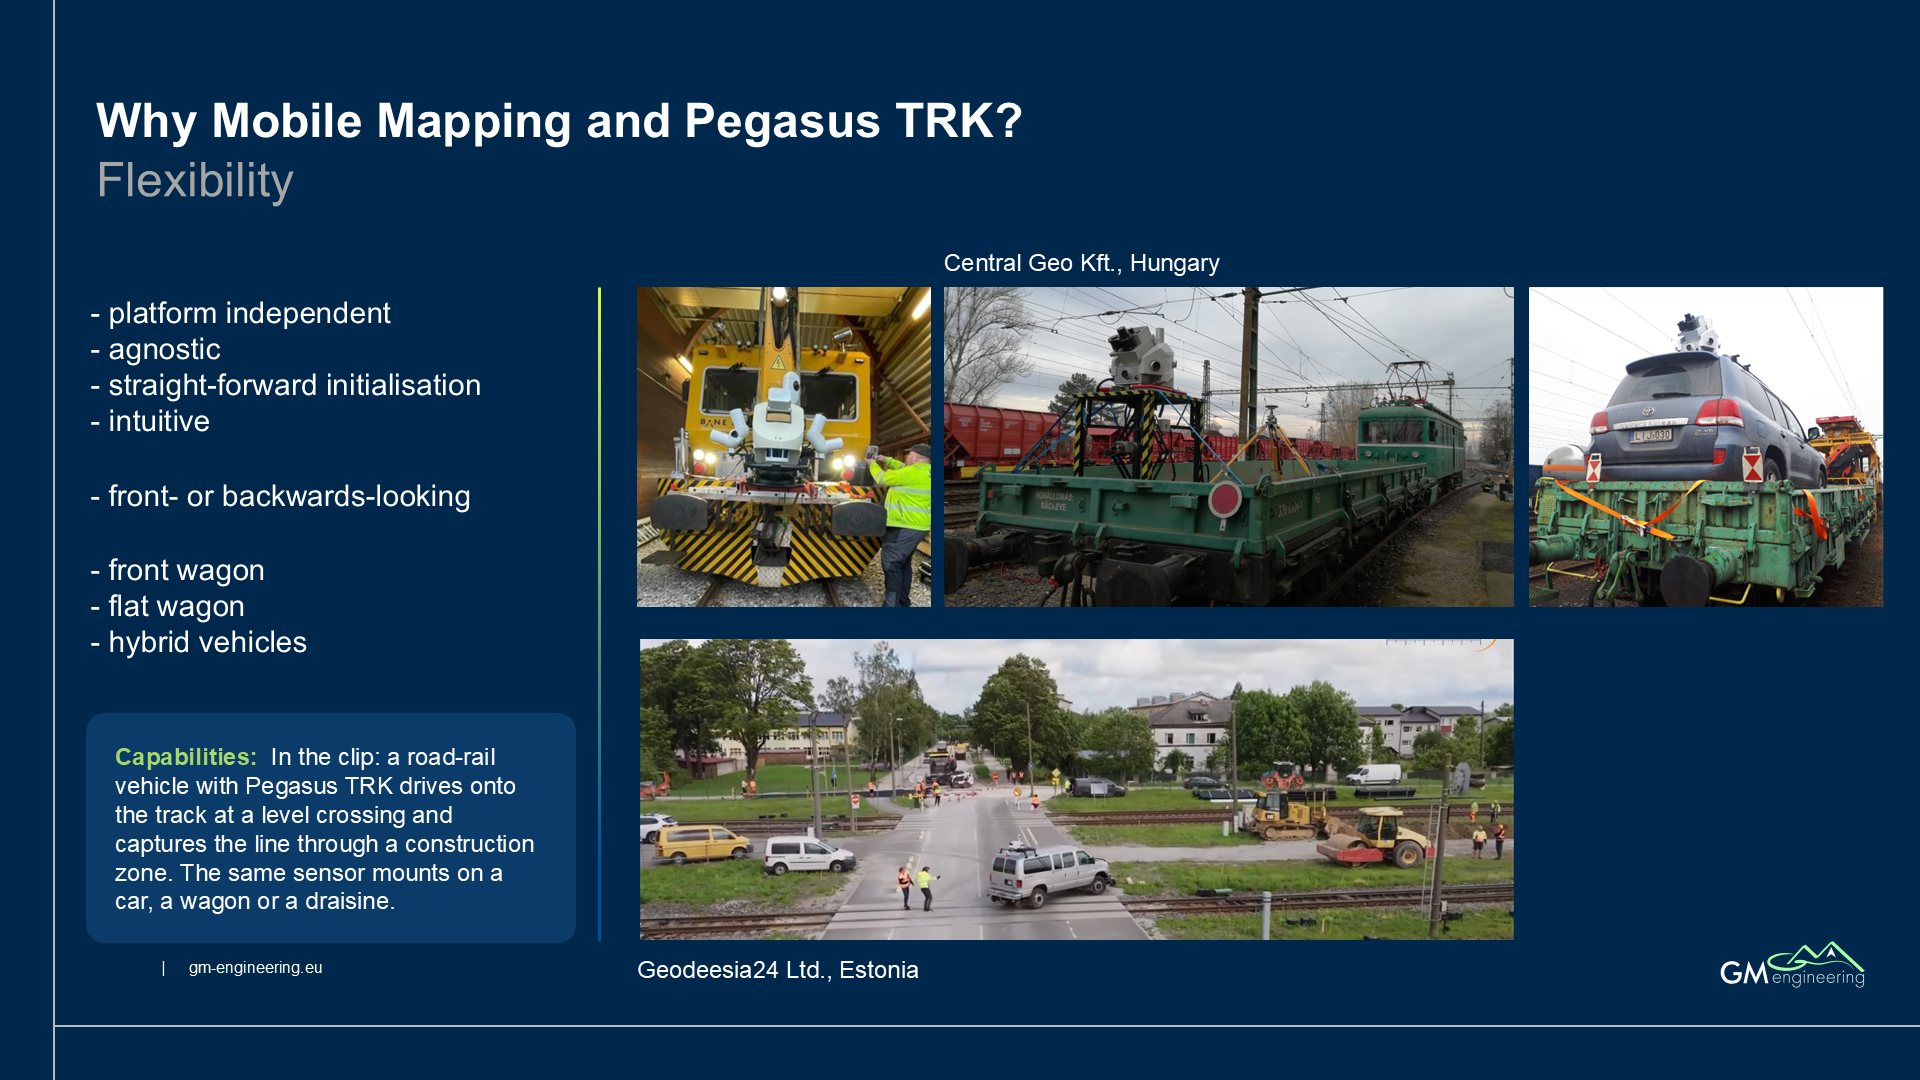
Central Geo Kft., Hungary
Geodeesia24 Ltd., Estonia
- platform independent
- agnostic
- straight-forward initialisation
- intuitive
- front- or backwards-looking
- front wagon
- flat wagon
- hybrid vehicles
Capabilities: In the clip: a road-rail vehicle with Pegasus TRK drives onto the track at a level crossing and captures the line through a construction zone. The same sensor mounts on a car, a wagon or a draisine.
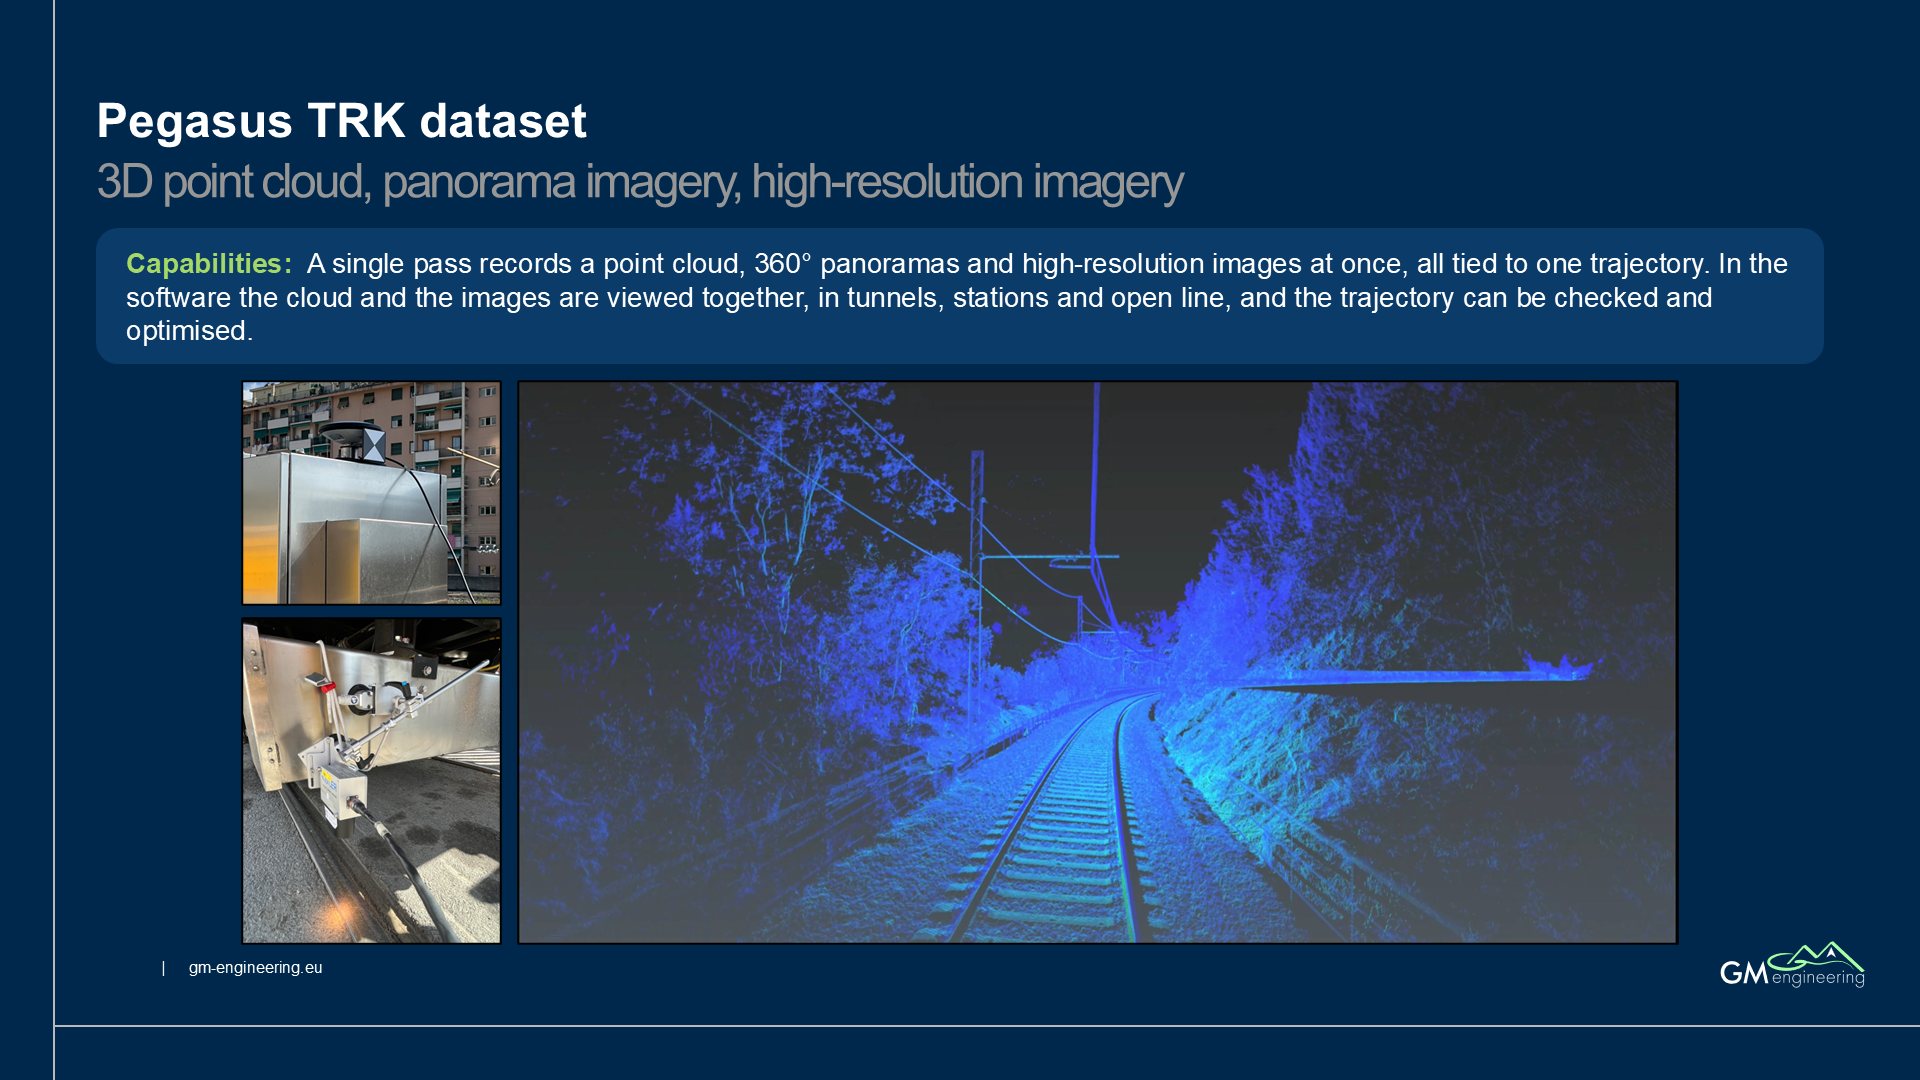
Pegasus TRK dataset
3D point cloud, panorama imagery, high-resolution imagery
Capabilities: A single pass records a point cloud, 360° panoramas and high-resolution images at once, all tied to one trajectory. In the software the cloud and the images are viewed together, in tunnels, stations and open line, and the trajectory can be checked and optimised.
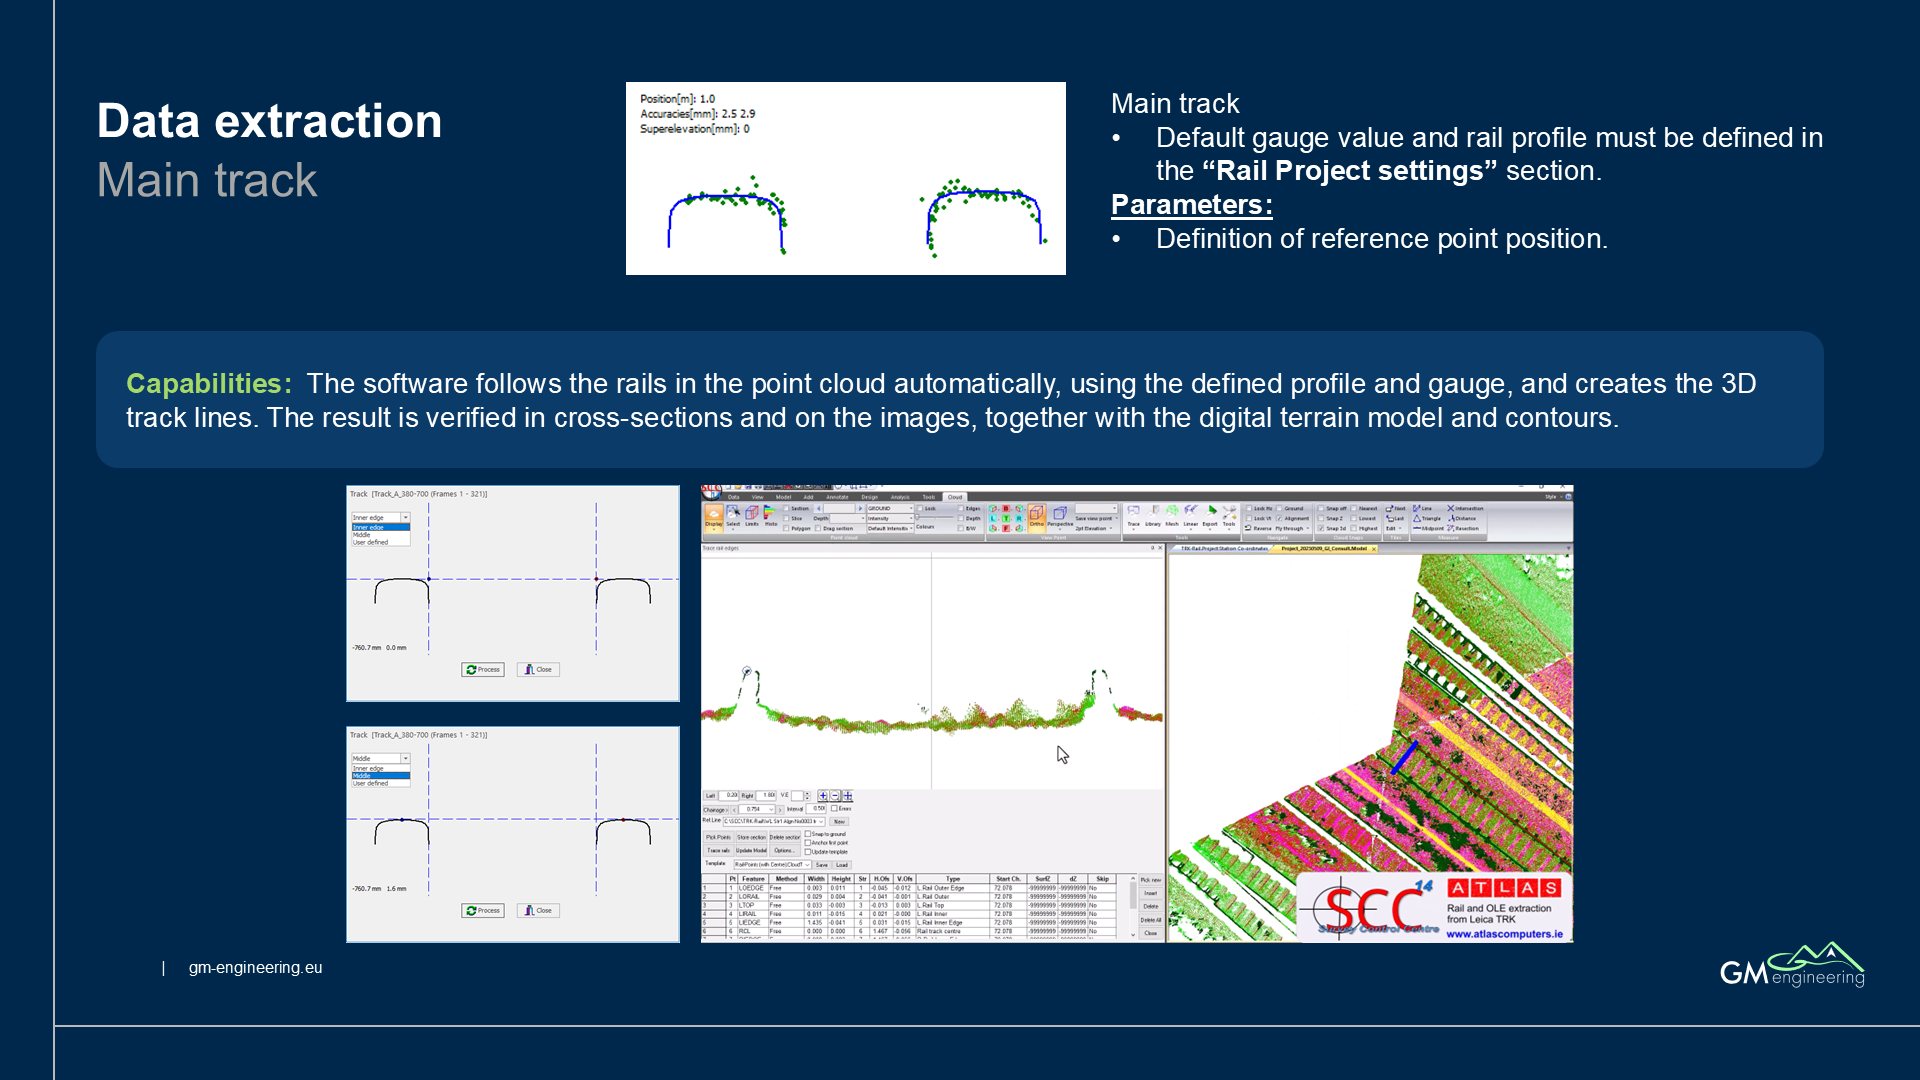
Data extraction
Main track
Default gauge value and rail profile must be defined in the “Rail Project settings” section.
Parameters:
Definition of reference point position.
Capabilities: The software follows the rails in the point cloud automatically, using the defined profile and gauge, and creates the 3D track lines. The result is verified in cross-sections and on the images, together with the digital terrain model and contours.
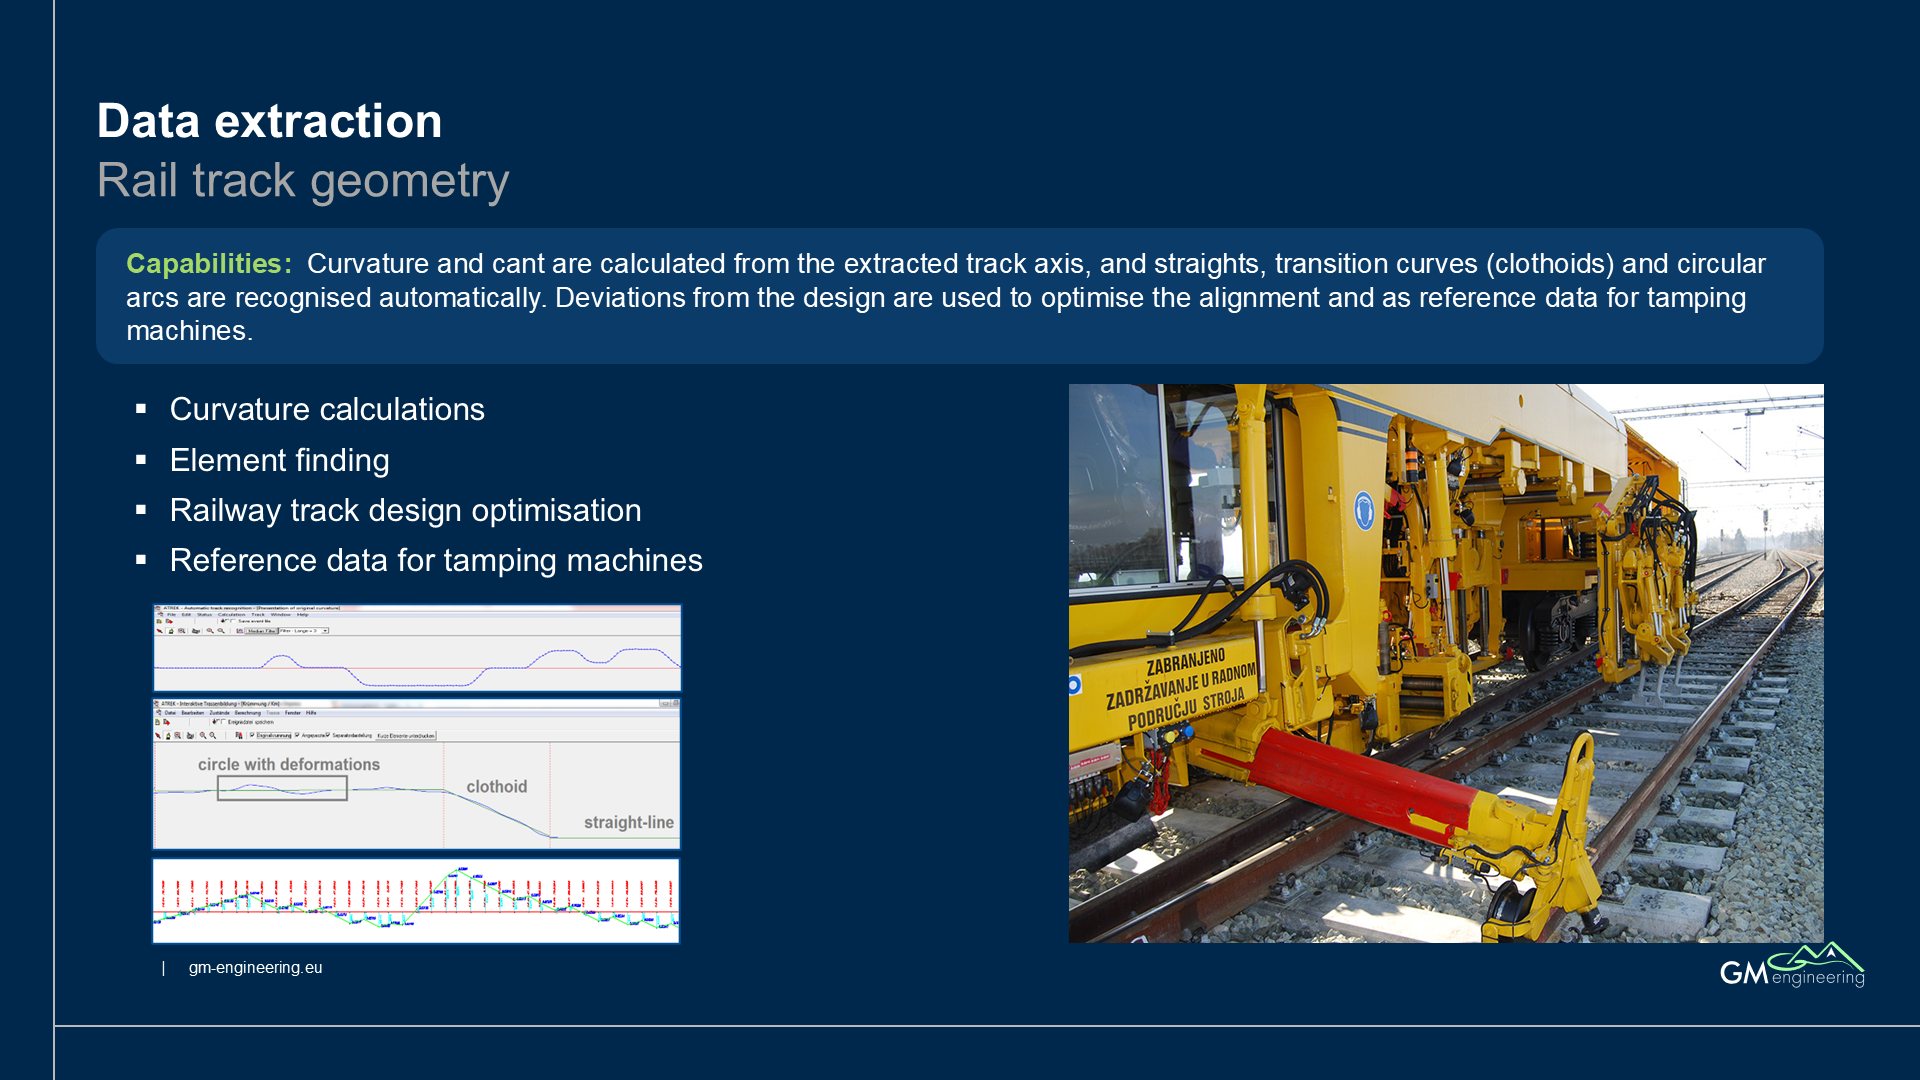
Data extraction
Rail track geometry
Curvature calculations
Element finding
Railway track design optimisation
Reference data for tamping machines
Capabilities: Curvature and cant are calculated from the extracted track axis, and straights, transition curves (clothoids) and circular arcs are recognised automatically. Deviations from the design are used to optimise the alignment and as reference data for tamping machines.
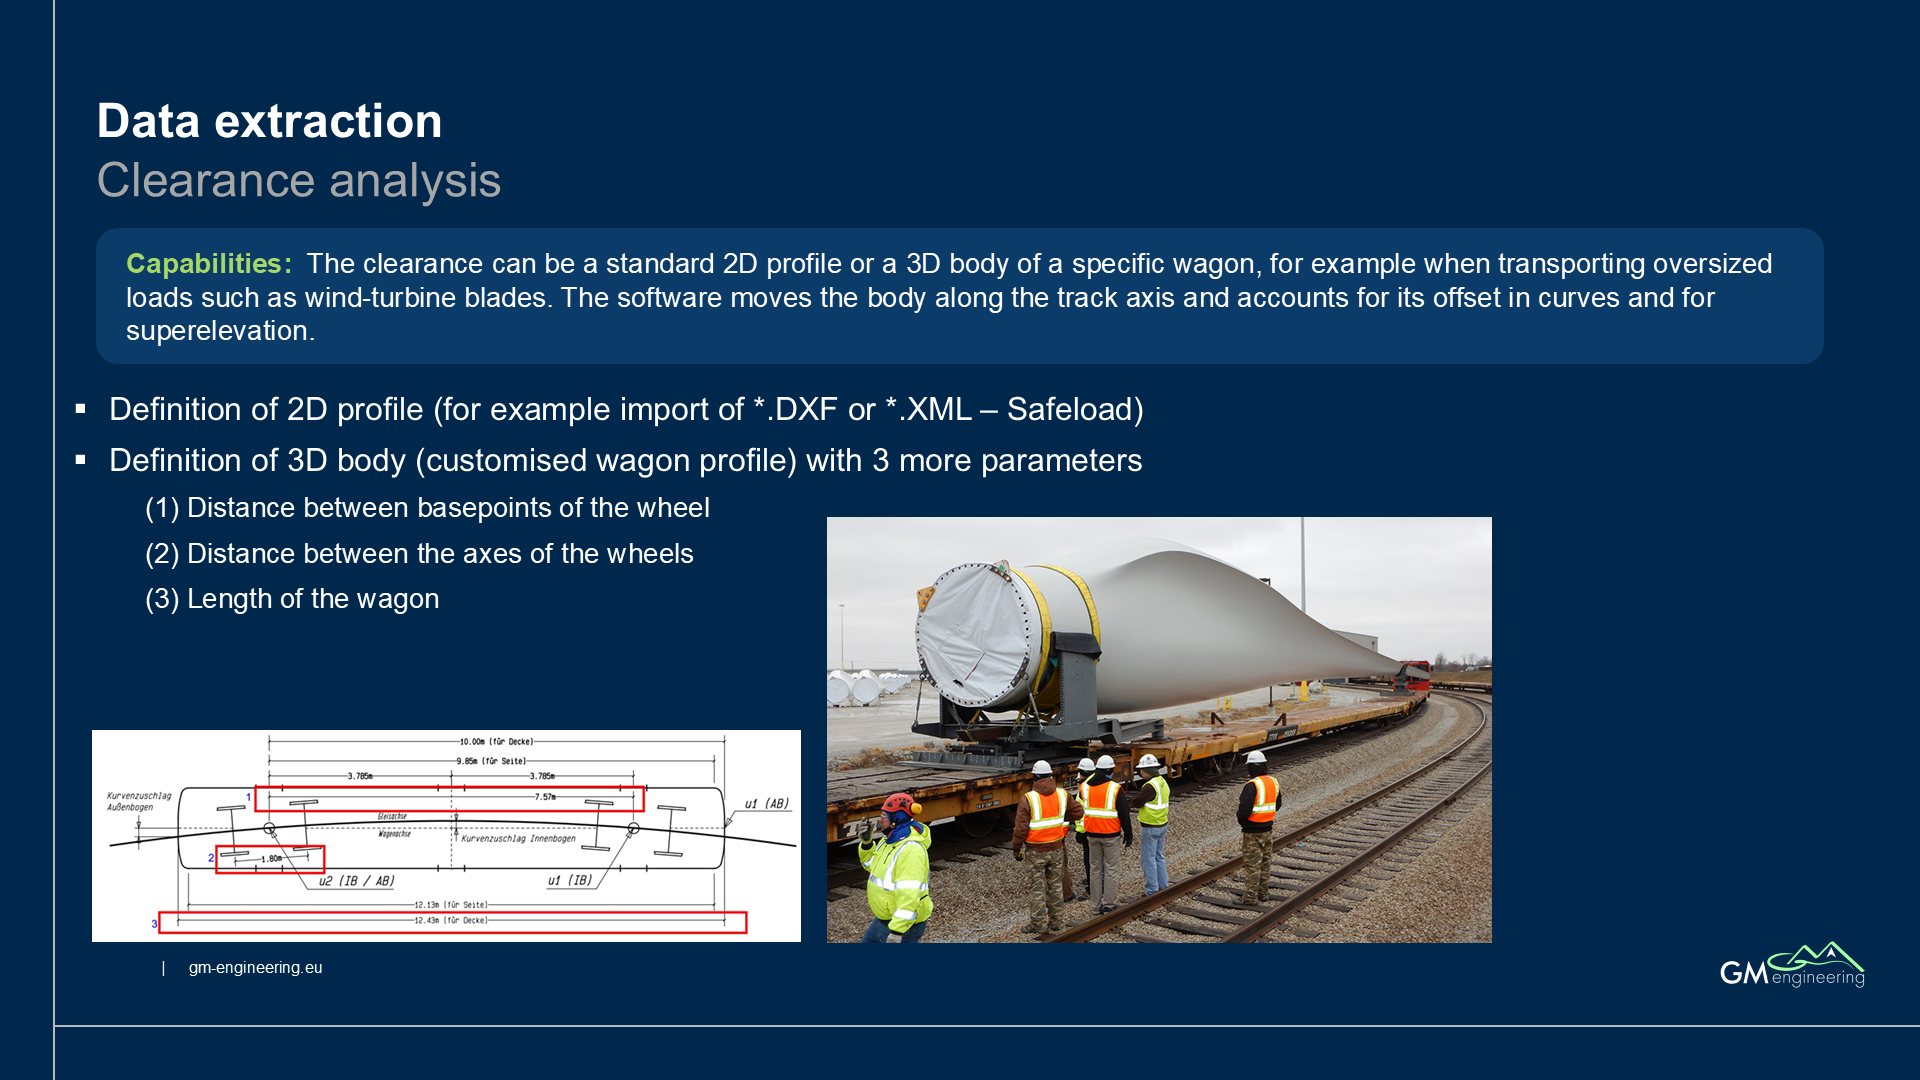
Data extraction
Clearance analysis
Definition of 2D profile (for example import of *.DXF or *.XML – Safeload)
Definition of 3D body (customised wagon profile) with 3 more parameters
(1) Distance between basepoints of the wheel
(2) Distance between the axes of the wheels
(3) Length of the wagon
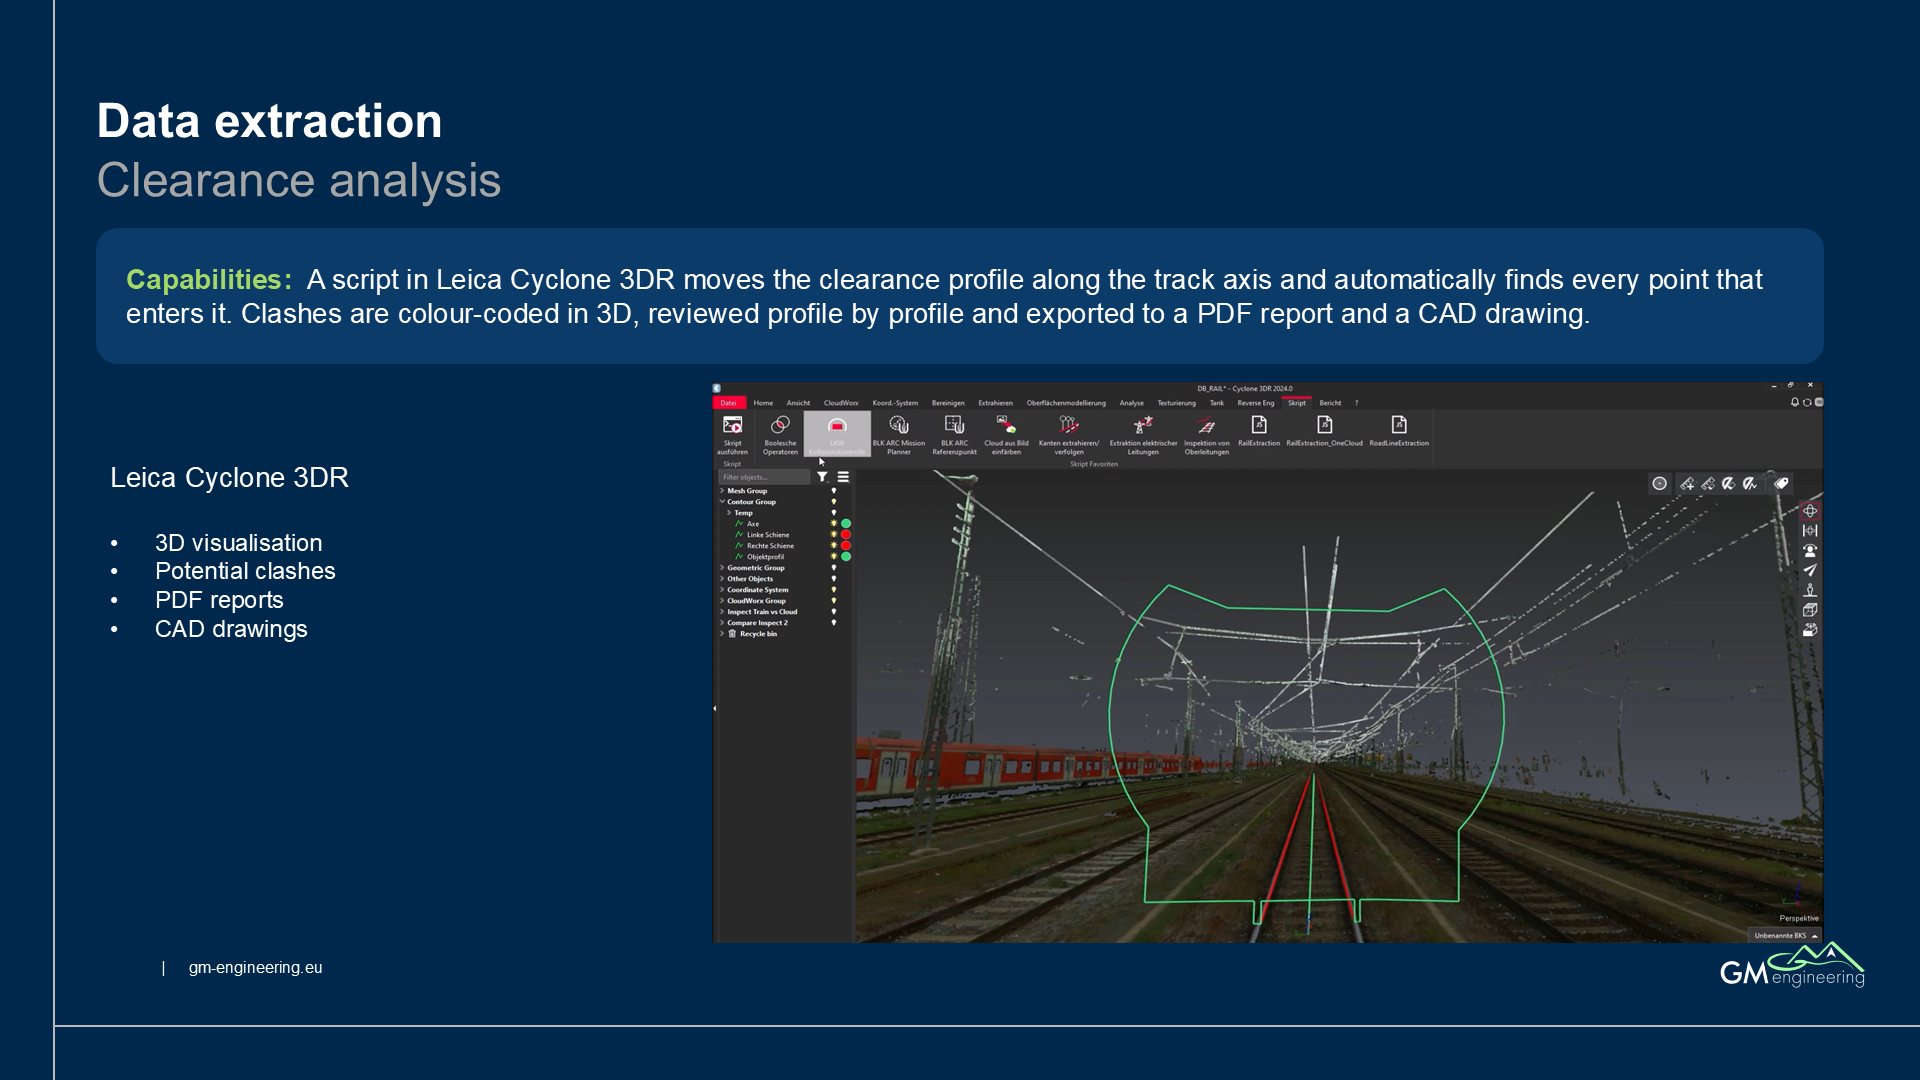
Capabilities: The clearance can be a standard 2D profile or a 3D body of a specific wagon, for example when transporting oversized loads such as wind-turbine blades. The software moves the body along the track axis and accounts for its offset in curves and for superelevation.
Data extraction
Clearance analysis
Leica Cyclone 3DR
3D visualisation
Potential clashes
PDF reports
CAD drawings
Capabilities: A script in Leica Cyclone 3DR moves the clearance profile along the track axis and automatically finds every point that enters it. Clashes are colour-coded in 3D, reviewed profile by profile and exported to a PDF report and a CAD drawing.
Data extraction
DTM ballast
Leica Cyclone 3DR
3D visualisation
Digital terrain models
Volume calculation
Construction progress analysis
Validation
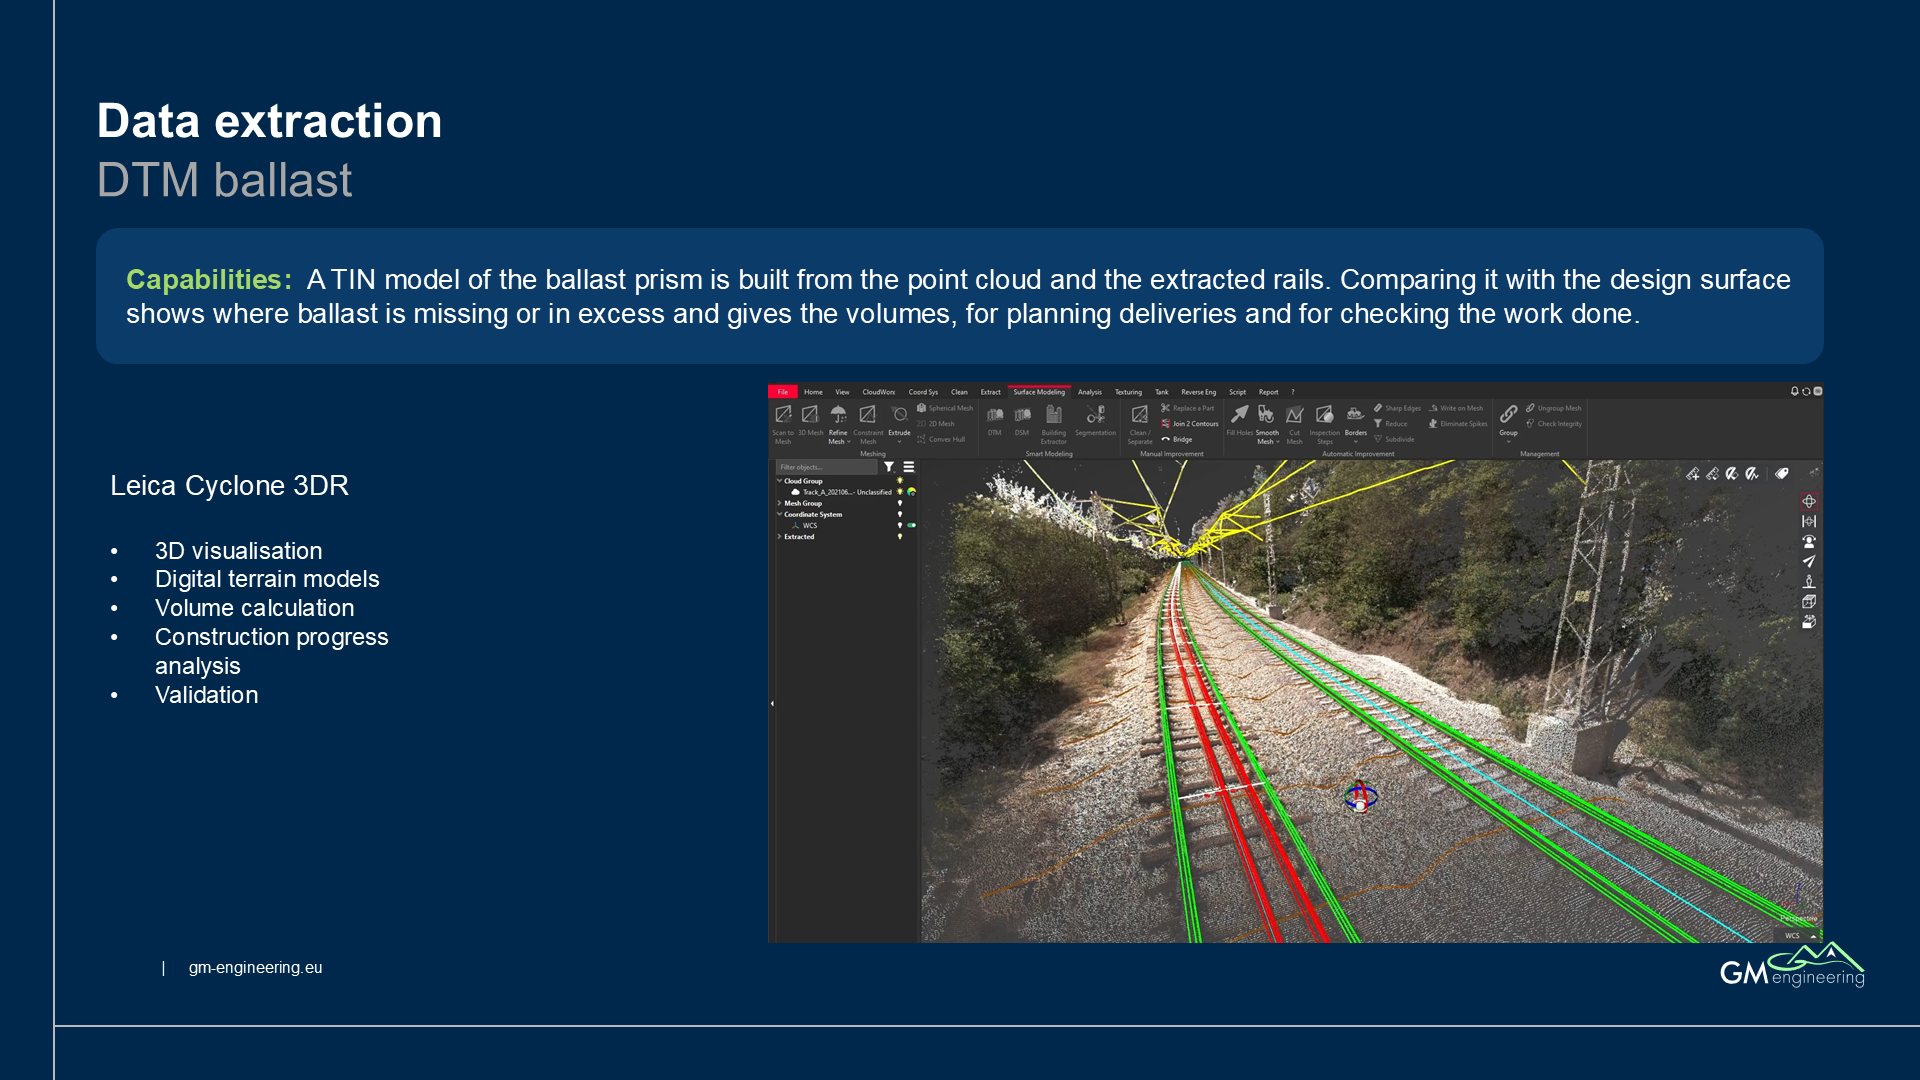
Capabilities: A TIN model of the ballast prism is built from the point cloud and the extracted rails. Comparing it with the design surface shows where ballast is missing or in excess and gives the volumes, for planning deliveries and for checking the work done.
Data extraction
Catenary – safety height
Leica Cyclone 3DR
Simulation of safety heights
3D visualisation
Reporting
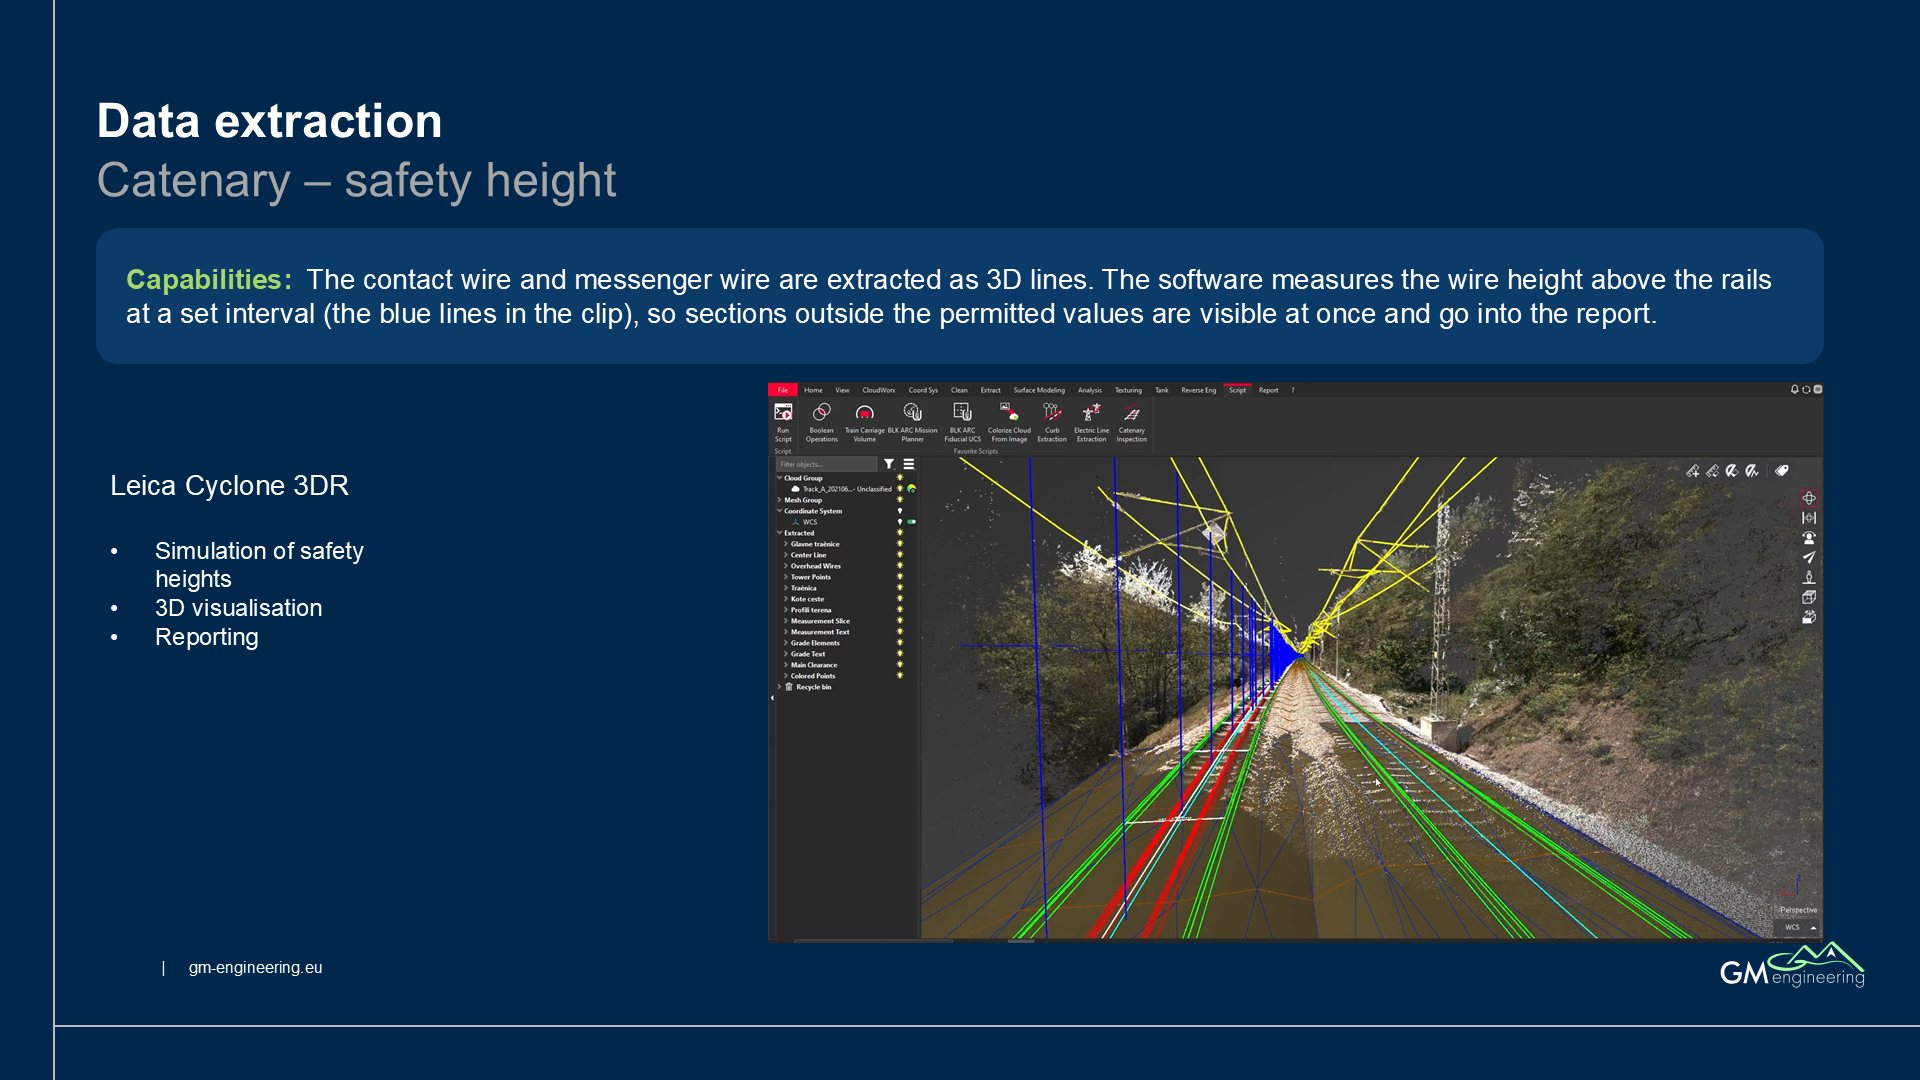
Capabilities: The contact wire and messenger wire are extracted as 3D lines. The software measures the wire height above the rails at a set interval (the blue lines in the clip), so sections outside the permitted values are visible at once and go into the report.
Classification
AI powered automation
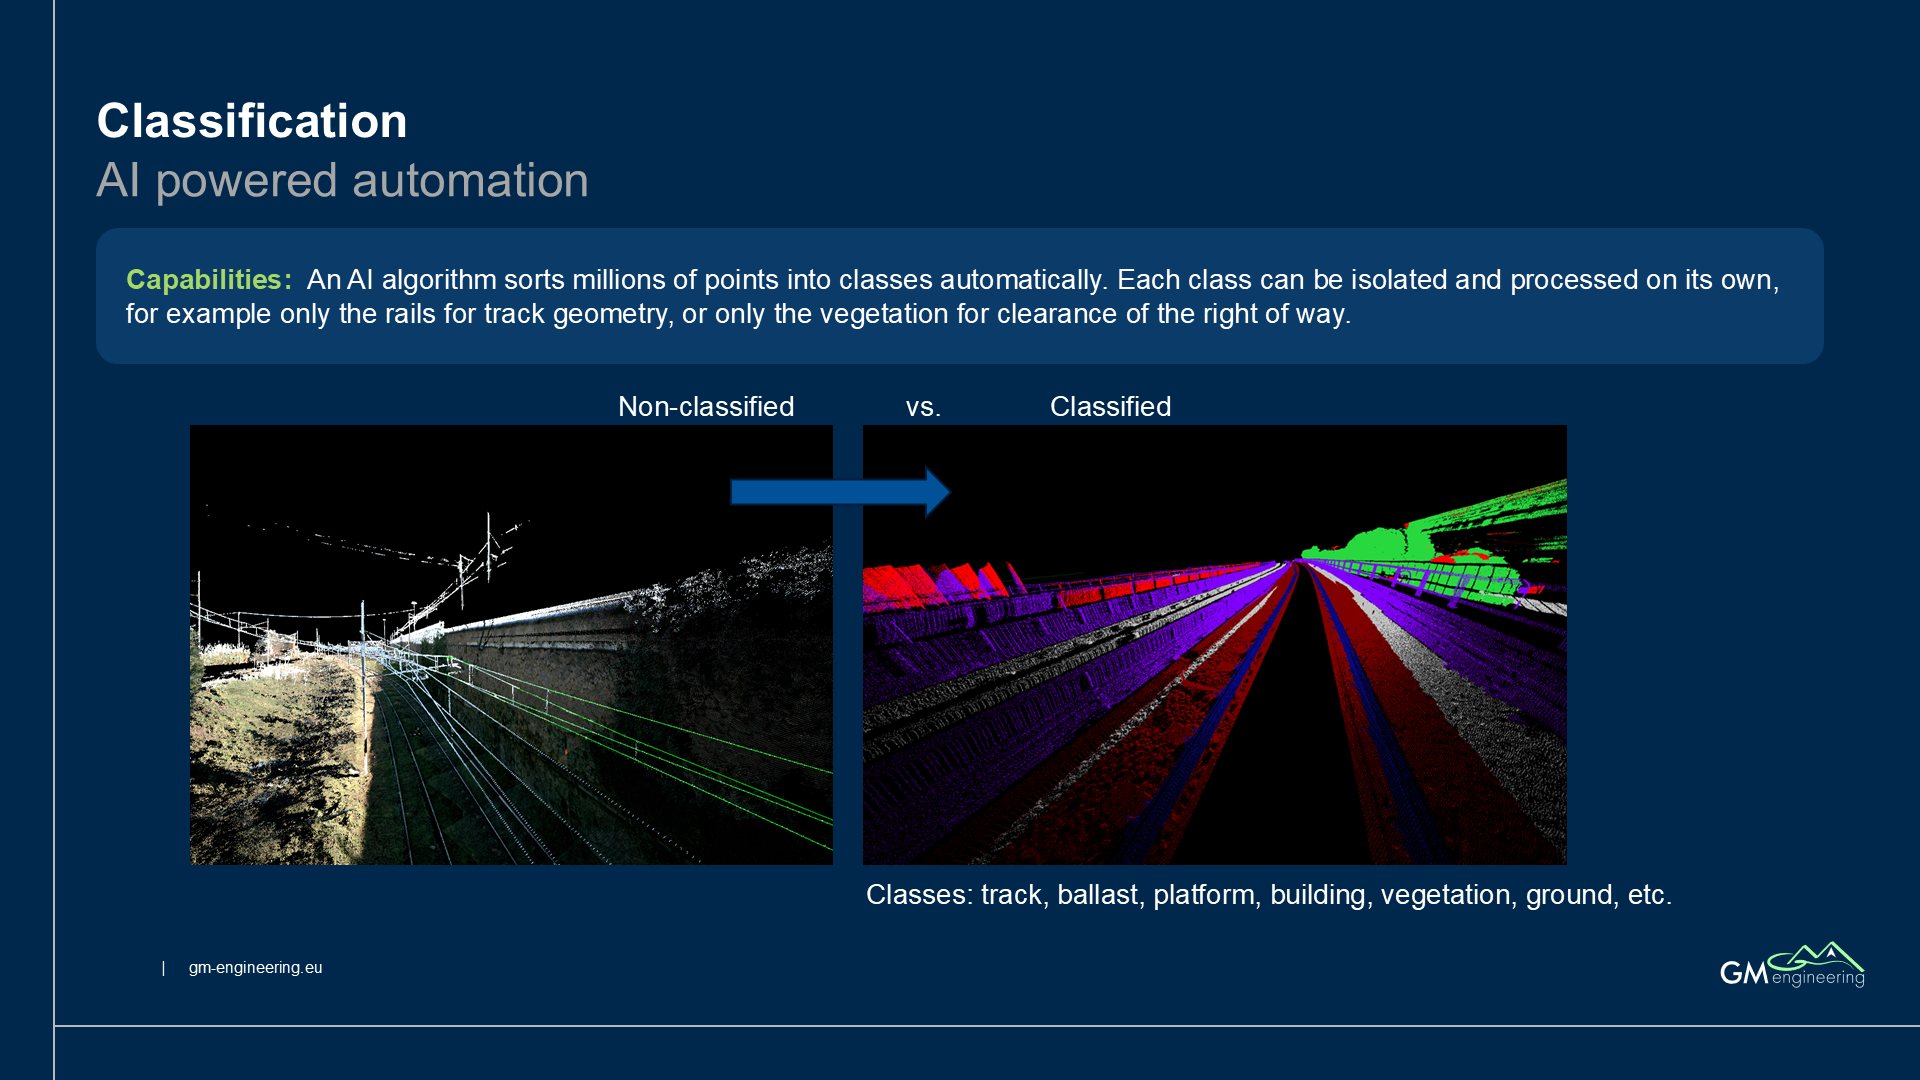
Classes: track, ballast, platform, building, vegetation, ground, etc.
Non-classified vs. Classified
Capabilities: An AI algorithm sorts millions of points into classes automatically. Each class can be isolated and processed on its own, for example only the rails for track geometry, or only the vegetation for clearance of the right of way.
Classification, segmentation and reporting
AI powered automation – object detection based on imagery data
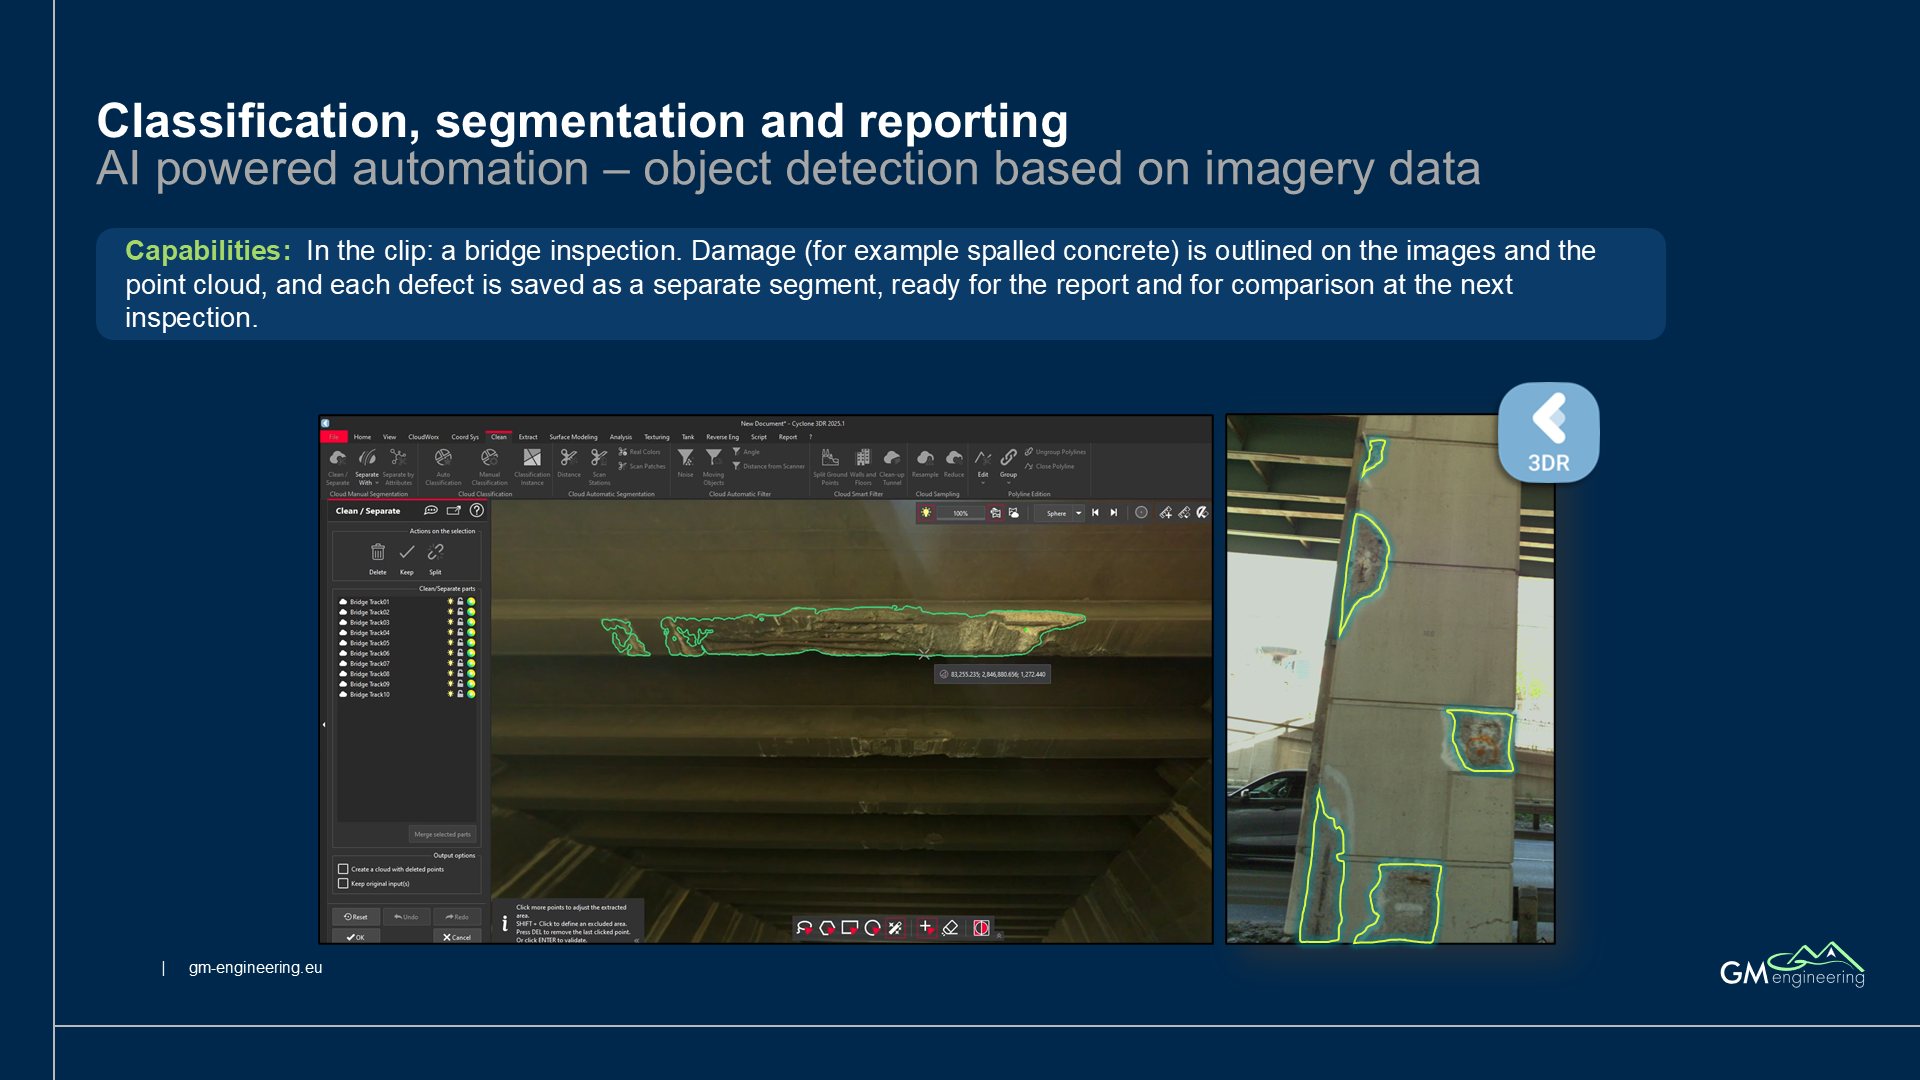
Capabilities: In the clip: a bridge inspection. Damage (for example spalled concrete) is outlined on the images and the point cloud, and each defect is saved as a separate segment, ready for the report and for comparison at the next inspection.
AI powered automation – object detection based on imagery data
GIS based asset management
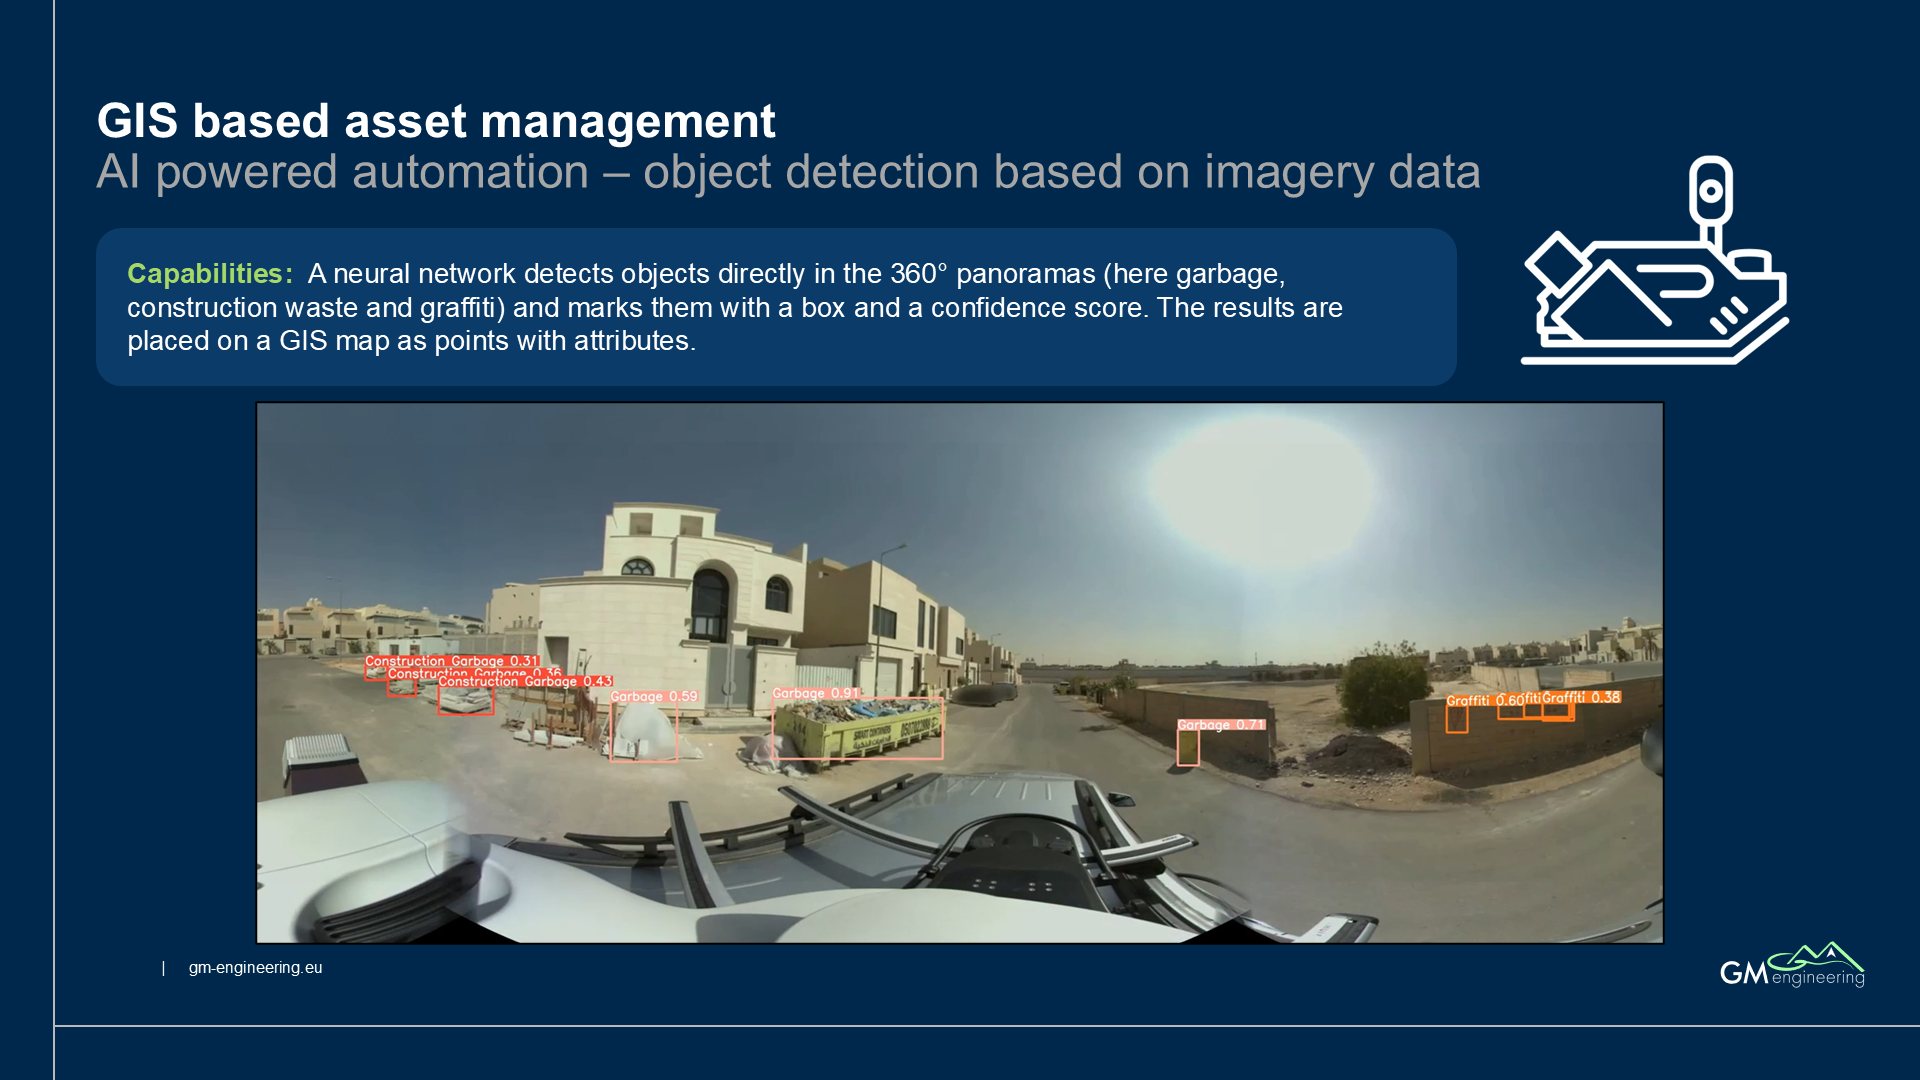
Capabilities: A neural network detects objects directly in the 360° panoramas (here garbage, construction waste and graffiti) and marks them with a box and a confidence score. The results are placed on a GIS map as points with attributes.
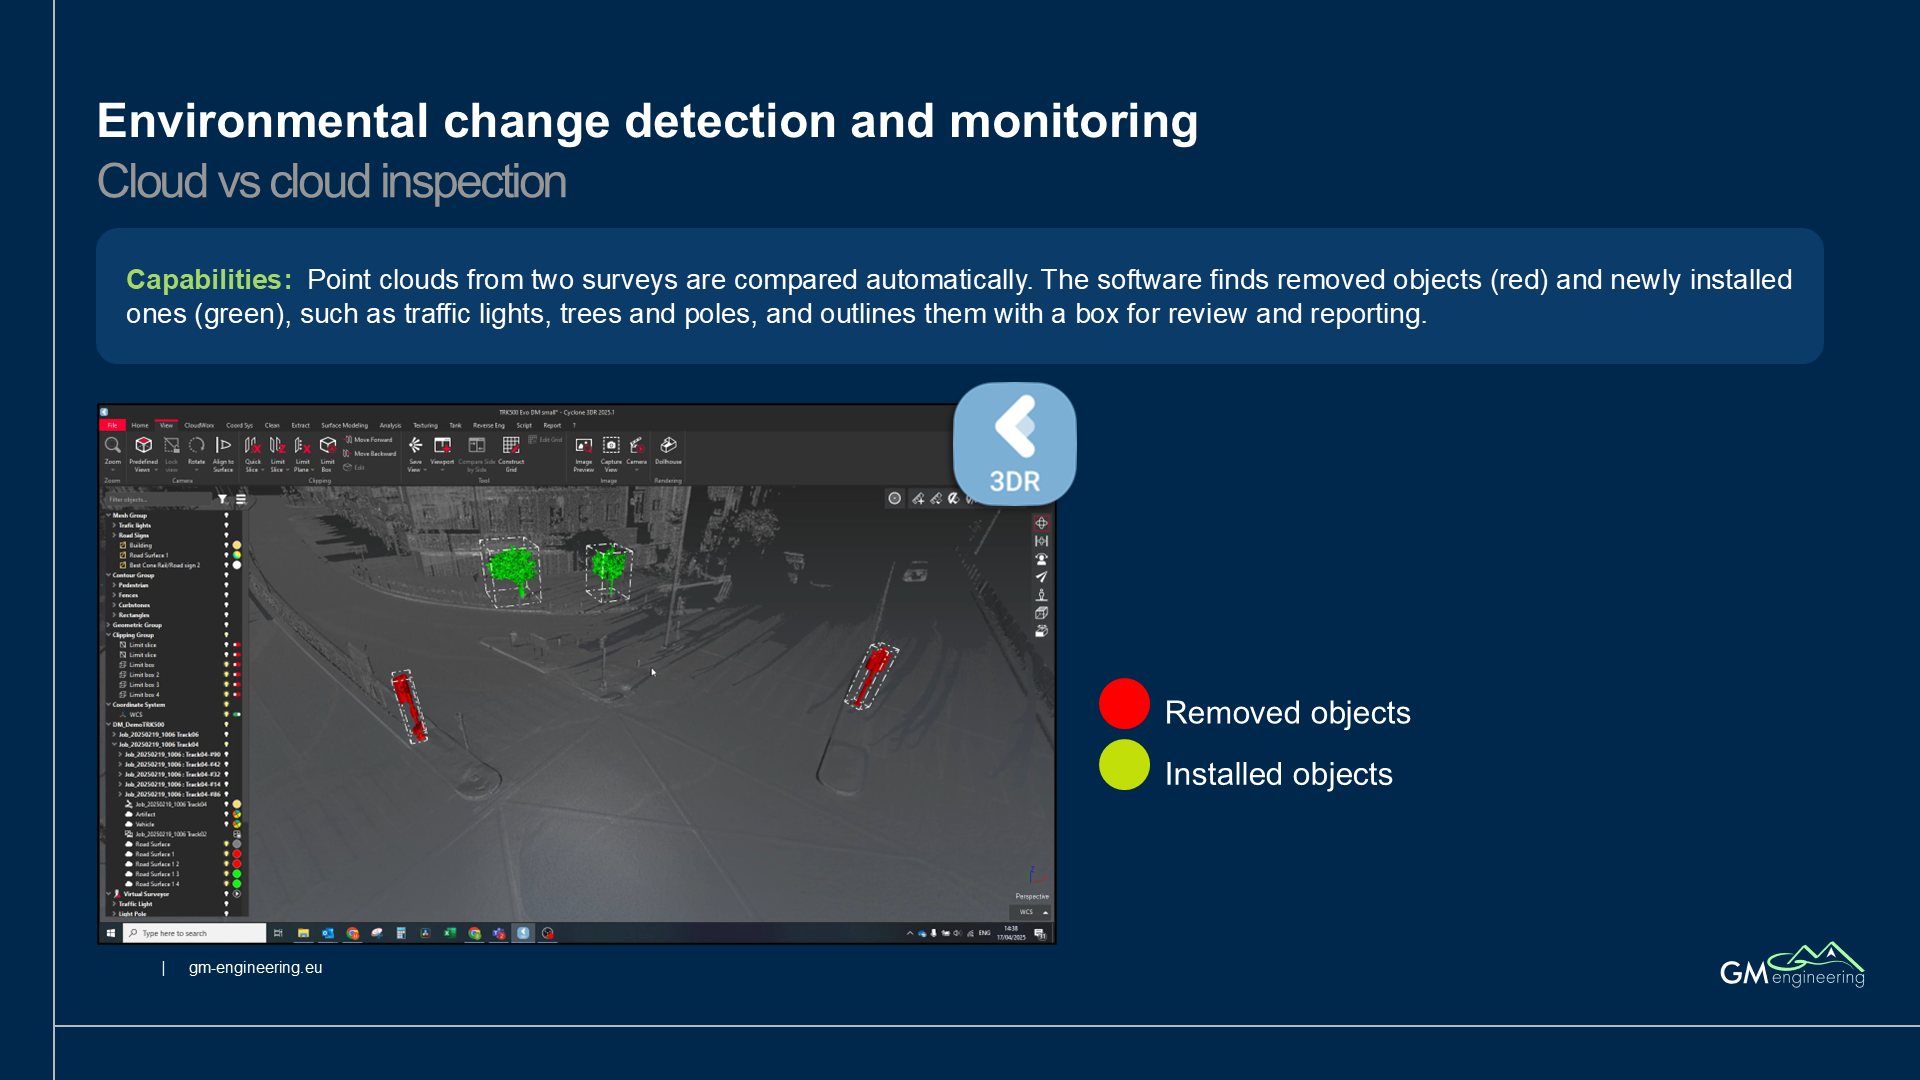
Removed objects
Installed objects
Environmental change detection and monitoring
Cloud vs cloud inspection
Capabilities: Point clouds from two surveys are compared automatically. The software finds removed objects (red) and newly installed ones (green), such as traffic lights, trees and poles, and outlines them with a box for review and reporting.
Thank you!